
Figure 1.
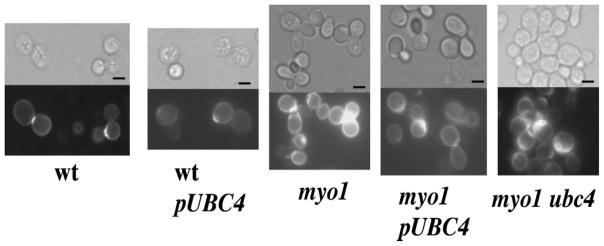
Visualization of chitin distribution by staining with Calcofluor white. myo1pUBC4, myo1, myo1 ubc4, wt and wtpUBC4 cells were cultured in ura− gal medium, fixed in 3.7% formaldehyde and stained with Calcofluor white. Light microscopy images are presented in the upper panels. Below each bright-field image is the corresponding fluorescence micrograph. Bar = 5 μm