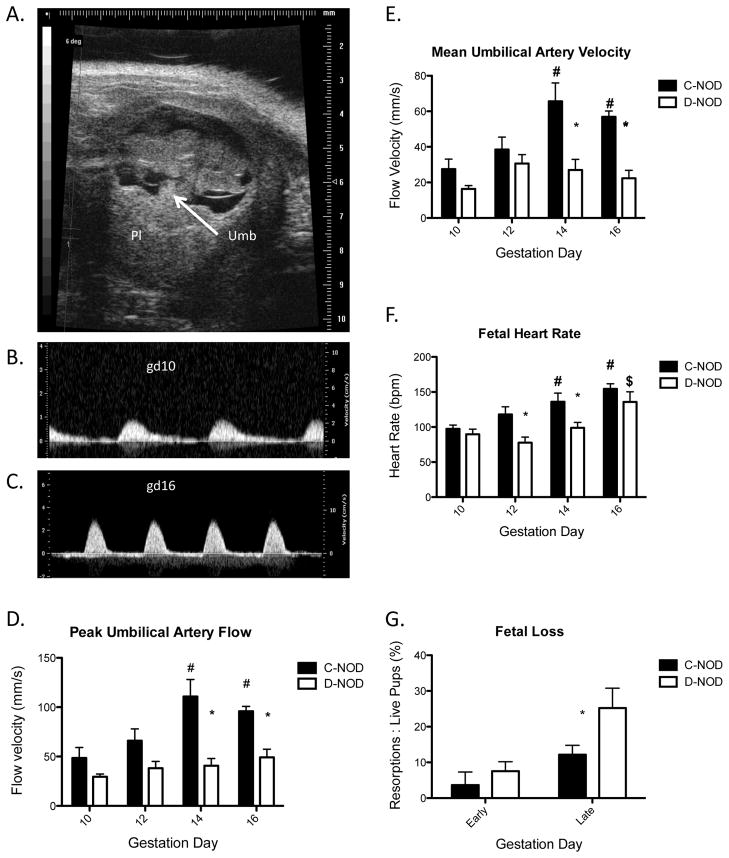
FIG. 4.
Fetal Scan. (A) Representative B-Mode image of a gd10 c-NOD fetus. (B) Representative PW Doppler image of umbilical artery in a gd10 c-NOD fetus. (C) Representative PW Doppler image of the umbilical artery in a gd16 c-NOD fetus. (D) Umbilical artery peak flow velocities, C-NODs showed an increase with increasing gestation (p=0.0012). Within time-points, c-NOD flow velocities are increased compared to d-NODs (p<0.0001), peak differences at gd14 and gd16 (p<0.001, p<0.05, respectively). A significant interaction was present between variables (p=0.047). (E) Umbilical artery mean flow velocities. C-NOD but not d-NOD peak flow velocities increased over gestational time-points measures (p=<0.0001) and differences between groups peaked at gd14 and gd16 (p<0.001, p<0.01, respectively). (F) Fetal heart rates. Similar to umbilical flow velocity, c-NOD fetal heart rates increased throughout gestation (p<0.0001) and are, overall, higher than fetuses of d-NOD dams (p<0.001). (G) Fetal loss as measured by percentage of resorptions to viable pups. Overall, fetal loss was elevated in d-NOD compared to c-NODs (p=0.036). Early gestation days for this study were defined as gd10 and 12, later gestation days were defined as gd14 and 16. Differences between groups did not differ at early gestation days but reached significance at later gestation days (p<0.05).
Minimum n=9 per group for all ultrasound data (minimum of three fetuses per dam, 3 dams per group at each gd). Significance between groups at each gestation day determined by two-way ANOVA with Bonferroni’s post-test, with p<0.05. Effect of gestation within each group determined by linear regression, increases and decreases over time defined by non-zero slope with p<0.05. Solid bars = c-NOD, white bars = d-NOD. Umb = Umbilical cord, Pl = Placenta. Single asterisks = significance between glycemic groups; hash tag = significance from gd10; dollar sign = significance from gd12.

