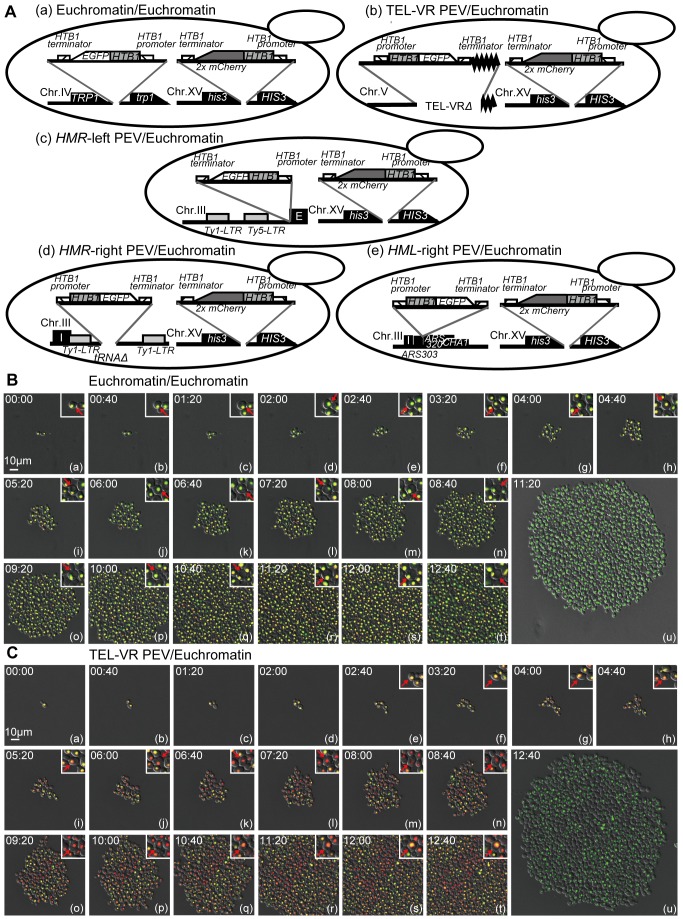
Figure 2. Gene expression states in PEV strains assessed by time-lapse imaging of single yeast cells.
(A) Schematic illustration of the yeast strains expressing EGFP and mCherry. Time-lapse images of the Euchromatin/Euchromatin (FUY257) (B) and TEL-VR PEV/Euchromatin (FUY355) (C) strains expressing HTB1-EGFP (green fluorescence) and HTB1-2x mCherry (red fluorescence). Overlap of the two fluorescent markers is indicated by yellow coloring. Image stacks were taken at 40 min intervals over a 12 h period and the differential interference contrast (DIC) image was merged. The larger panel shows a wide focus image in which only the HTB1-EGFP signal is displayed. Single cells are shown in the insets at the top right corner of each panel; the red arrowhead indicates the same cell in each image. Scale bar, 10 µm. See also Movies S1 and S2.

