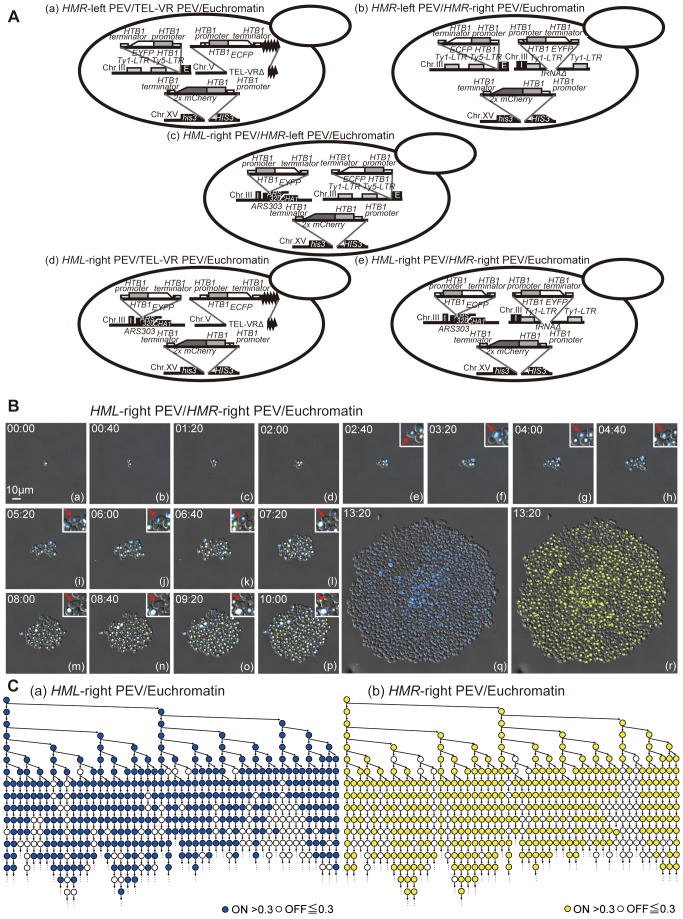
Figure 8. Gene expression states in PEV strains expressing three different fluorescently labeled proteins.
(A) Schematic illustration of the yeast strains expressing EYFP, ECFP, and mCherry. (B) Time-lapse images of the HML-right PEV/HMR-right PEV/Euchromatin (FUY810) strain. The ECFP signal is shown in blue, the EYFP signal is shown in yellow, and the mCherry signal is shown in red. Overlap of these fluorescent markers is indicated by white coloring. Image stacks were taken at 40 min intervals over a 10 h period and the differential interference contrast image was merged. Panels (q) and (r) show wide focus images that display the ECFP and EYFP signals, respectively. The red arrowhead indicates the same cell in each image. Scale bar, 10 µm. See also Movies S4. (C) Representative lineage trees showing the fluorescence intensities of the ECFP (a) and EYFP (b) signals in the HML-right PEV/HMR-right PEV/Euchromatin (FUY810) strain tracked in real time. The highest positioned circle on the left side indicates the first single cell; the downward arrowhead pointing from this circle to the right side indicates the daughter cell, and the downward arrow indicates the divided mother cell. Blue and yellow circles indicate a fluorescence intensity >0.3 and white circles indicate a fluorescence intensity <0.3. Not every cell is indicated on this tree due to spatial constraints. Every cell was counted and the data are summarized in Table S7.

