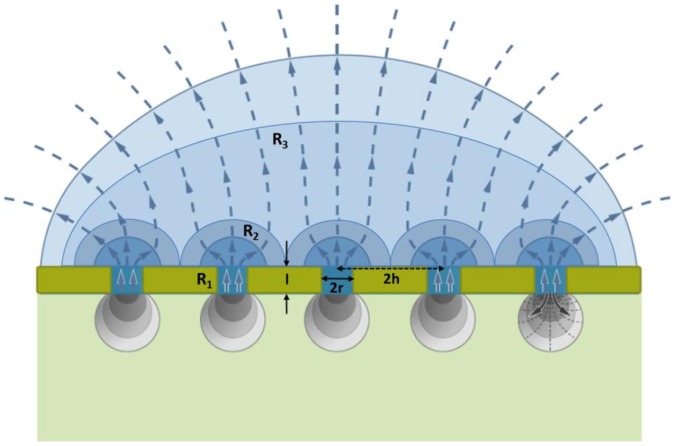
Figure 2. Gas exchange resistances and diffusion fields for water vapor and CO2 over plant leaves.
Diffusion flow lines (dashed lines) and equal concentrations lines (solid lines) for water vapor in the boundary layer over the leaf (blue areas) and for atmospheric CO2 within the substomatal cavities (grey areas) are shown. The figure depicts the consecutive three diffusive resistances resulting from the interactions between neighboring stomata, as expressed in Eqs. (6–9). The schematic representation is adapted from Bange [33].

