
Figure 2. Plasma concentration of D-dimer in healthy controls and patients on HD.
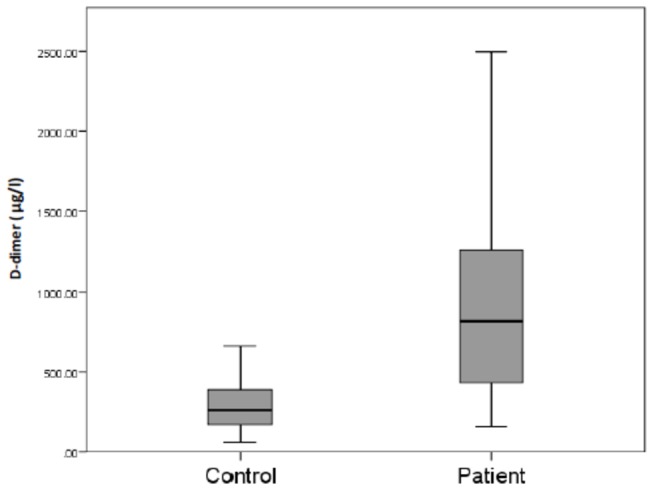
D-dimer was quantified by ELISA and the results expressed on a box plot showing the median (bars), minimum and maximum values (whiskers), and interquartile range (box).