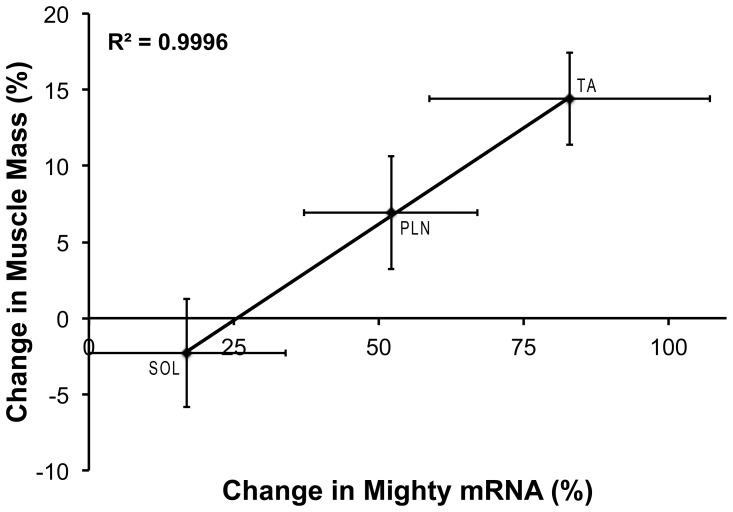
Figure 2. Correlation between average Mighty mRNA expression in 3 different muscles 6 hours after stimulation and average hypertrophy after 6 weeks of training.
Since the expression of Mighty increased 6 h following an acute bout of resistance exercise in the TA muscle, Mighty expression was determined in the soleus (SOL) and plantaris (PLN) muscles as well. Mighty mRNA at 6 h was plotted against data on the increase in muscle mass following 6 weeks of repeated bouts of resistance exercise from a previous study using this model [12]. There was a significant correlation between the mean difference in Mighty mRNA in each muscle at 6 h and the mean difference in muscle mass following 6 weeks of training (R2 = 0.9996).

