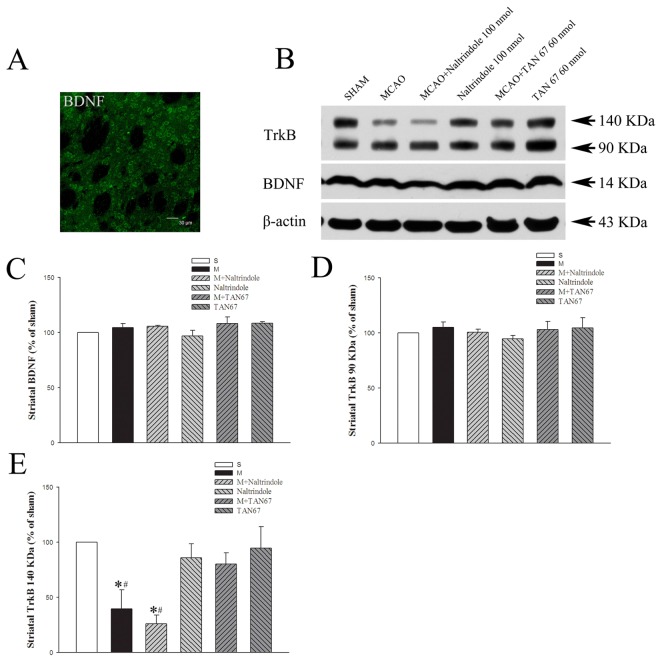
Figure 4. Effects of TAN-67 and Naltrindole on striatal expression of BDNF and TrkB at 24 hrs after MCAO.
A, Representative fluorescent micrographs of striatal BDNF positive cells in sham group. Bar = 30 µm. B, Representative Western blot images of BDNF and TrkB expression in different groups. C, Quantitative analysis of BDNF. D, Quantitative analysis of 90 KDa TrkB. E, Quantitative analysis of 140 KDa TrkB. n=4. *P<0.05 vs. the sham. # P<0.05 vs. M+TAN67. S, Sham control. M, MCAO. Note that MCAO significantly reduced the expression of 140 KDa TrkB but not of BDNF and 90 KDa TrkB, while DOR activation with TAN67 largely reversed the ischemic reduction of 140 KDa TrkB expression.

