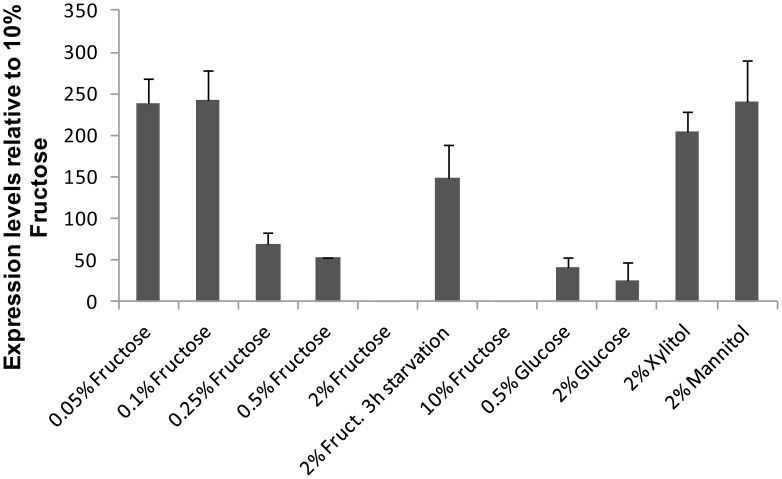
Figure 6. ZrFSY1 expression in Z. rouxii CBS 732.
Reverse transcription quantitative-PCR (RT-qPCR) analysis of ZrFSY1 gene expression in Z. rouxii CBS 732 cells grown in YNB medium containing various carbon sources at 30°C. All media were inoculated (initial OD640 0.02–0.06) with cells pre-grown on 2% glucose. Exponentially growing cells were collected at OD640 0.6–1.2 and RNA was extracted and analyzed by RT-qPCR. The relative expression of ZrFSY1 was normalized against ACT1 expression and the expression levels are represented as relative to the lowest value (10% fructose). The results are expressed as mean ± S.D. from at least two independent experiments.

