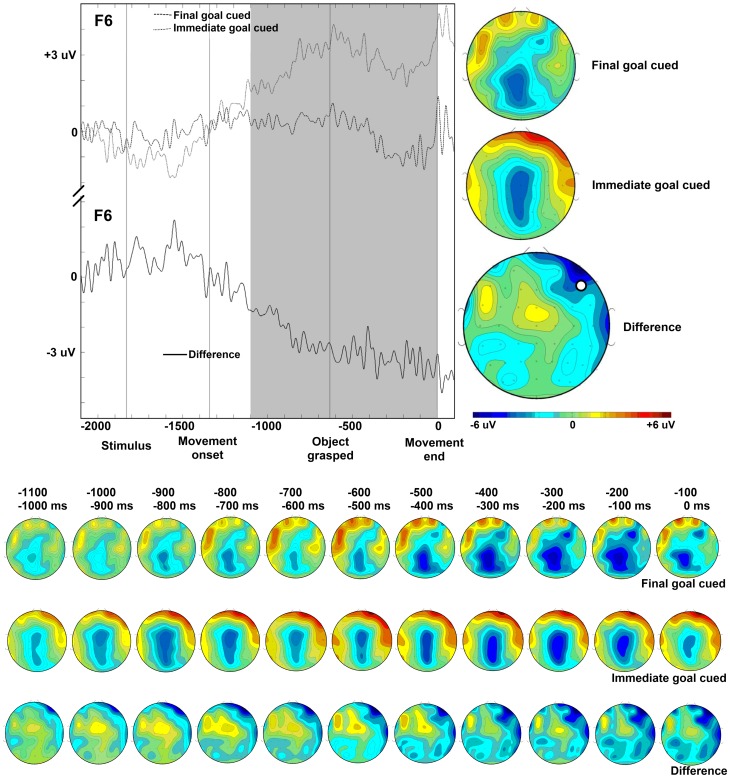
Figure 5. Slow wave brain potentials time-locked to movement end.
Time is shown in milliseconds. (TOP LEFT) Event-related slow wave potentials recorded at the right lateral frontal electrode F6, time-locked to movement end, for the final goal-cued condition (dashed), the immediate goal-cued condition (dotted), and the difference between the two cueing conditions (solid). The labels ‘Stimulus’, ‘Movement onset’, and ‘Object grasped’ mark the average time points of these events. (TOP RIGHT) Topography of slow waves recorded in the −1100 ms to 0 ms time interval before movement end (indicated by the grey selection), in the final goal cueing condition, the immediate goal cueing condition, and the difference between the two cueing conditions. The location of electrode F6 on the scalp is illustrated by a white marker. (BOTTOM) Topography of slow waves recorded in the −1100 to 0 ms time interval before movement end displayed in consecutive 100 ms intervals, in the final goal-cued condition, the immediate goal-cued condition, and the difference between the two cueing conditions.

