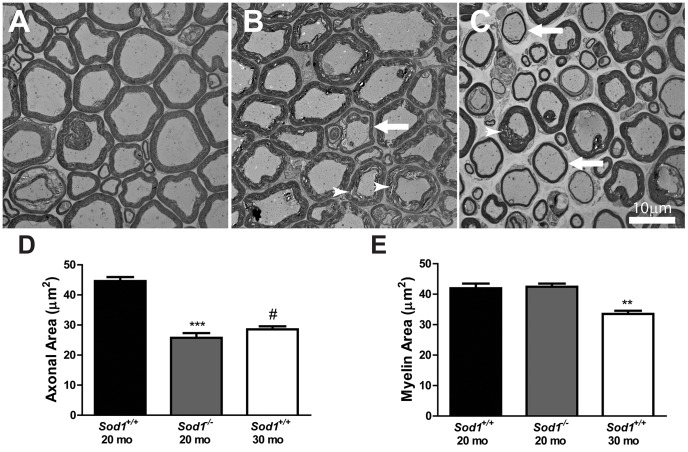
Figure 6. Structural deficits in the axons and myelin of motor neurons in the Sod1 mice.
Transmission electron microscopy (TEM) of the ventral roots from A) Sod1 +/+ mice at 20 mo, B) Sod1 −/− mice at 20 mo, and C) Sod1 +/+ mice at 30 mo revealed thinning myelin (arrow) and delaminating myelin (arrow head). Scale bar = 10 µm. The area of D) axons and E) myelin in the ventral root was measured by light microscopy in the Sod1 +/+ mice at 20 and 30 mo (n = 9, 3, and 5, respectively) and Sod1 −/− mice at 20 mo (n = 19, and 10). **p<0.001, ***p<0.0001, and #p<0.0001 compared to Sod1 +/+ mice at 20 mo.

