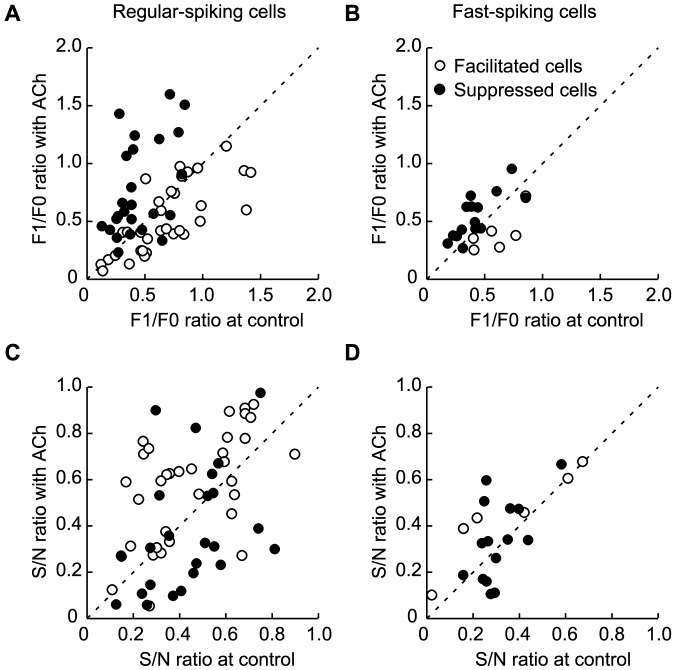
Figure 9. Cholinergic effects on the F1/F0 and S/N ratios in RS and FS cells.
A–D: Population data of the F1/F0 (A, B) and S/N ratios (C, D). All cells showing contrast-dependent gain control by ACh administration were analyzed (A and C, RS, n = 60; B and D, FS, n = 22). Facilitated and suppressed cells are indicated by open and filled circles, respectively.

