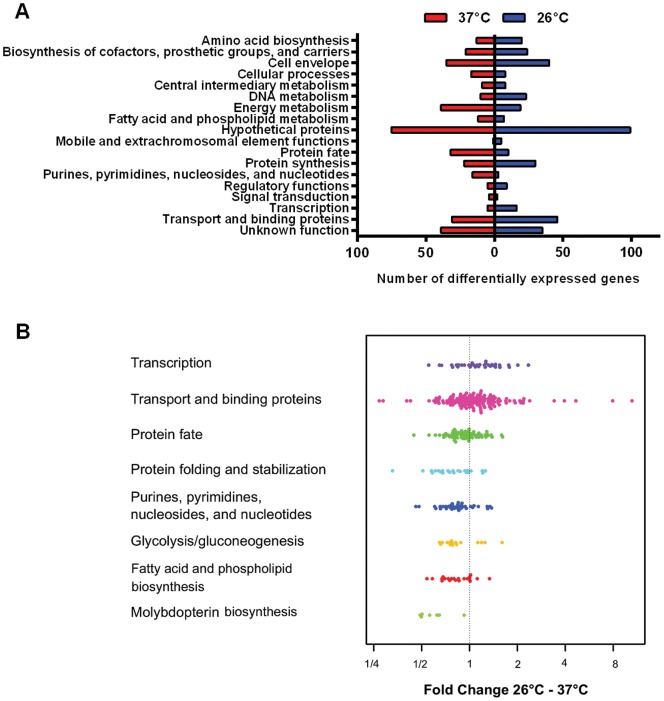
Figure 2. Functional categories of M.catarrhalis genes induced or repressed following cold shock.
A. Differentially expressed genes (Table S4) were broadly categorized according to their biological function. Each bar represents the actual number of genes. Blue bars indicate number of genes that are upregulated at 26°C, and red bars represent number of genes that are downregulated at 26°C. B. The sets of up- or downregulated genes (based on DESeq analysis) were tested for enrichment in specific functional categories. Average log2 fold-changes of individual genes are shown for categories with adjusted p-values<5%.

