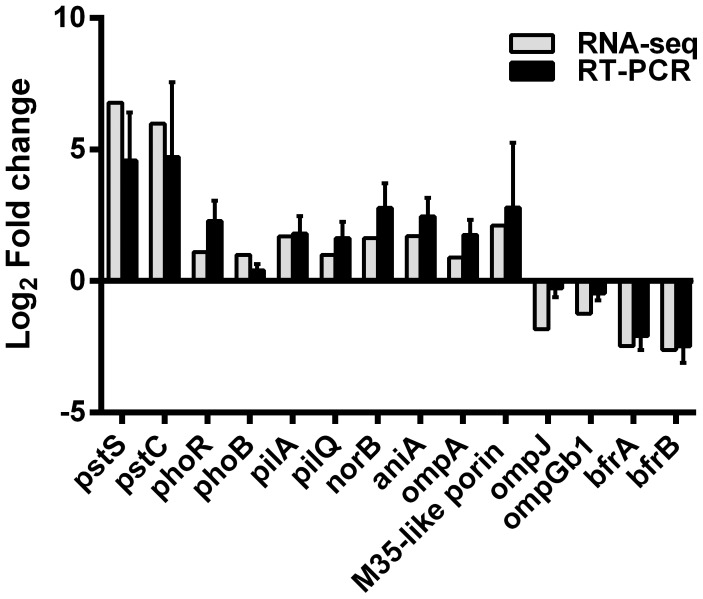
Figure 3. qRT-PCR validation of differentially expressed genes.
Fold changes of the expression levels of genes pstS encoding phosphate ABC transporter, periplasmic phosphate-binding protein PstS; pstC encoding phosphate transport system permease protein PstC; phoR encoding two-component system phosphate regulon sensor histidine kinase PhoR; phoB encoding two-component system phosphate regulon response regulator PhoB; pilA encoding type IV pilin PilA; pilQ encoding type IV pilus secretin PilQ; norB encoding nitric oxide reductase NorB; aniA encoding nitrite reductase AniA/Msp78; ompA encoding OmpA family protein; m35-like porin encoding M35-like porin protein, ompJ encoding outer membrane protein J, ompG1b encoding outer membrane protein G1b; bfrA and bfrB encoding bacterioferritins were compared to those detected by RNA-seq. The log2 of the fold difference in gene expression between 26°C and 37°C temperatures as determined by qRT-PCR (black columns) is plotted adjacent to the results obtained in RNA-seq analysis (grey columns). The results of qRT-PCR are expressed as means ±1 SD of three separate experiments performed in duplicate.

