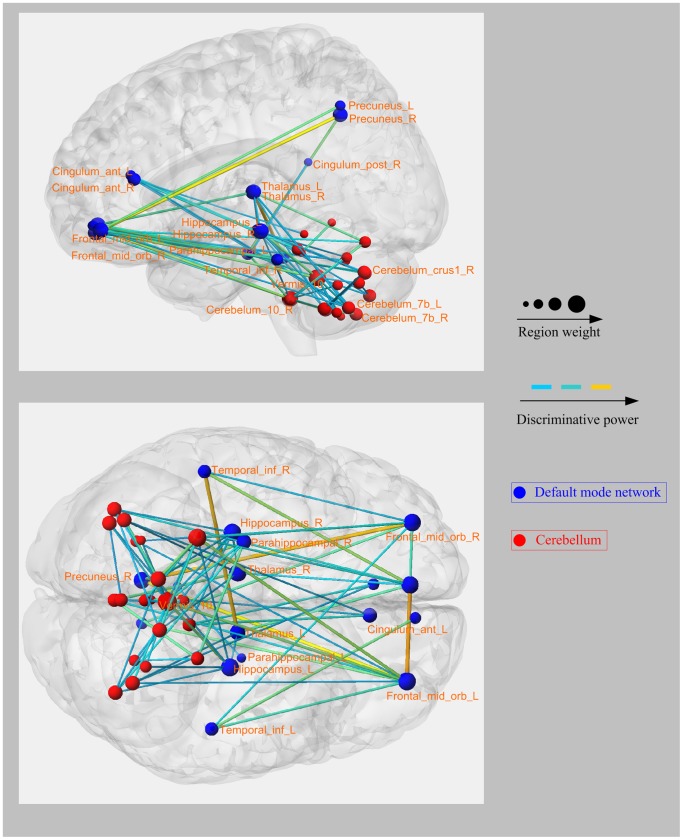
Figure 4. Left and bottom views of the convergent functional connectivity patterns with high discriminative power.
Regions are color-coded by category. The line colors representing the discriminative power of the relative connections are scaled with their mean discriminative power in the leave-one-out cross-validation.

