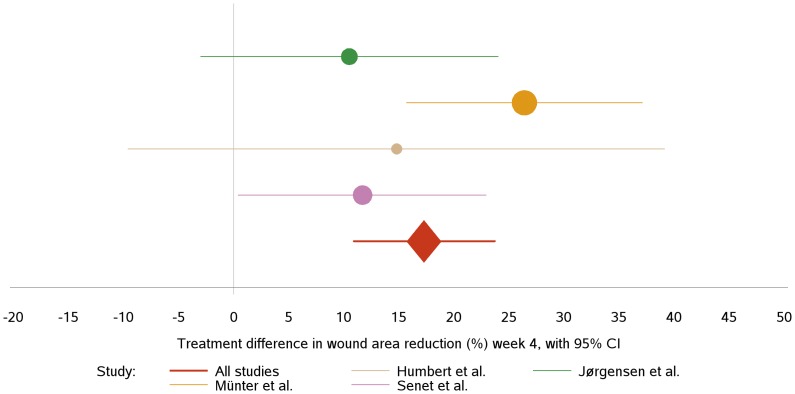
Figure 2. Forest plot showing the estimated treatment differences defined by percentage relative reduction.
The solid vertical line represents a treatment difference of zero. The confidence intervals (95%) are illustrated by the length of the horizontal lines. The sizes of the filled circles are adjusted to the size of the corresponding study.

