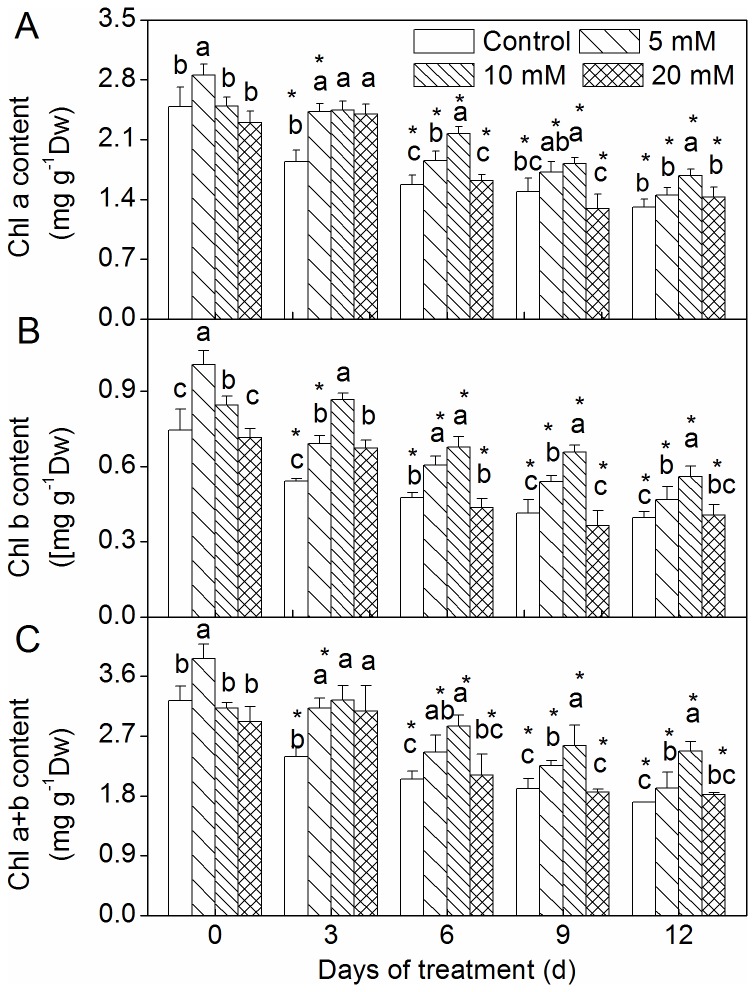
Figure 3. Effect of CaCl2 on chlorophyll content of Zoysia japonica leaves under drought.
(A) Chl a content; (B) Chl b content; (C) Chl a+b content. Vertical bars represent standard deviations (n=3). The different letters indicate significant difference among different treatments on a given day (p < 0.05, LSD multiple test). The asterisks indicate significant difference between given day and 0 d at the same treatment (p < 0.05, LSD multiple test).

