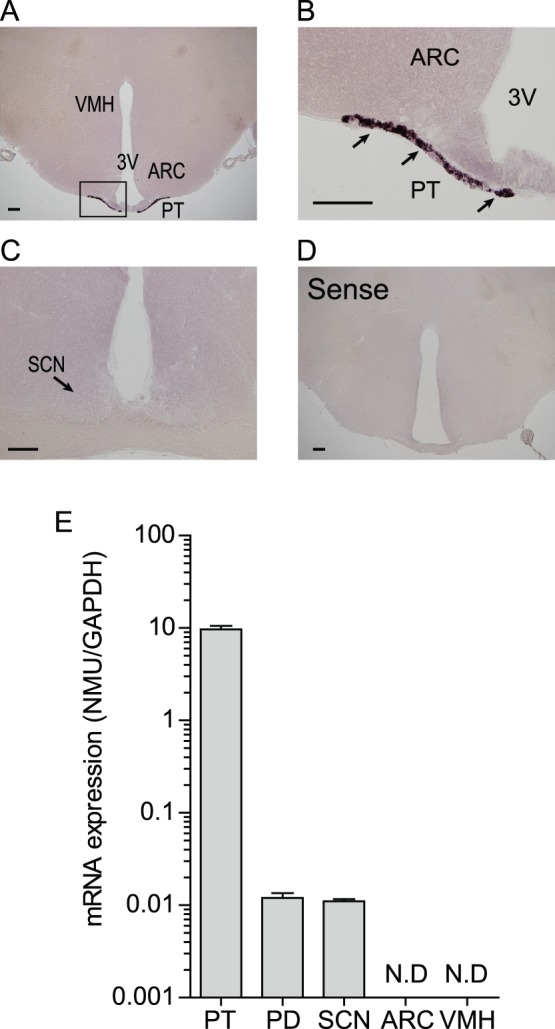
Figure 1. NMU mRNA expression regions in the brain of male Wistar rats.

(A) Microphotograph of NMU mRNA expression regions detected by ISH staining on free-floating brain sections with DIG-labeled cRNA probes for rat whole brain. A strong signal was detected in the PT. No signal was detected in the other areas, including the VMH and ARC. (B) Magnified image of the boxed area in A. NMU mRNA-expressing cells were widely distributed throughout the PT. (C) No signal for NMU mRNA expression was detected in the SCN. (D) Sense RNA probes to NMU generated no specific signal. Scale bar: 200 µm. PT, pars tuberalis; ARC, arcuate nucleus; VMH, ventromedial hypothalamic nucleus; 3V, third ventricle; SCN, suprachiasmatic nucleus. (E) qPCR analysis of NMU in the PT, PD, SCN, ARC, and VMH using LMD samples. High expression was detected in the PT, low expression was detected in the PD and SCN, and no expression was detected in the ARC and VMH. All values are means ± S.E.M. (n = 4).
