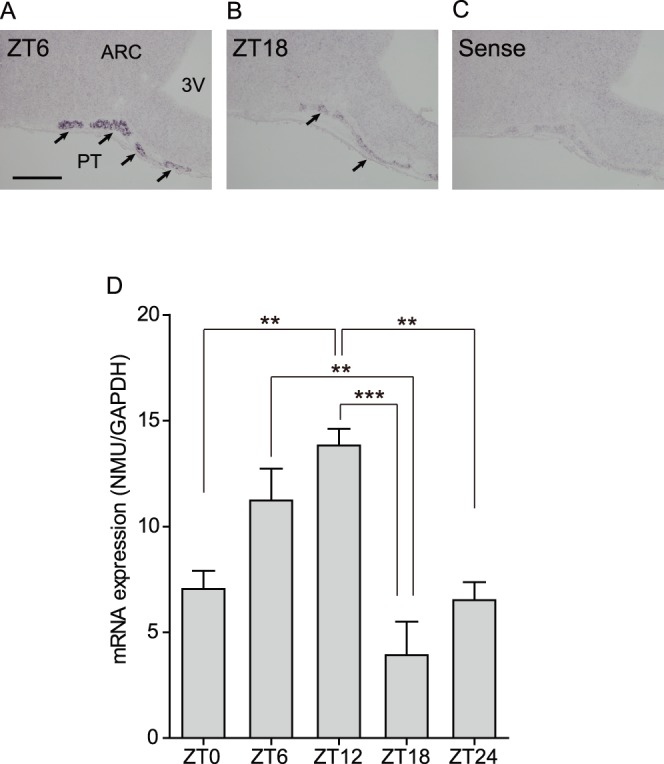
Figure 3. Diurnal change of NMU mRNA expression in the rat PT.

(A, B) Microphotograph of NMU mRNA expression detected by ISH staining on fresh frozen sections. The staining signal in the PT (arrows) was high at ZT6 (light phase) and low at ZT18 (dark phase). (C) Sense RNA probes for NMU generated no specific signal. Scale bar: 200 µm. PT, pars tuberalis; ARC, arcuate nucleus; 3V, third ventricle. (D) qPCR analysis of NMU using LMD samples of the PT at ZT0, 6, 12, 18, and 24. The expression level fluctuated in a time-dependent manner. NMU mRNA expression was low at ZT0 and gradually increased, and then reached a peak at ZT12. The level was decreased at ZT18 and remained low at ZT24. All values are means ± S.E.M. (n = 4). Significant differences were detected by one-way analysis of variance (P = 0.0004) and Tukey’s multiple comparison test (** P<0.01, *** P<0.001).
