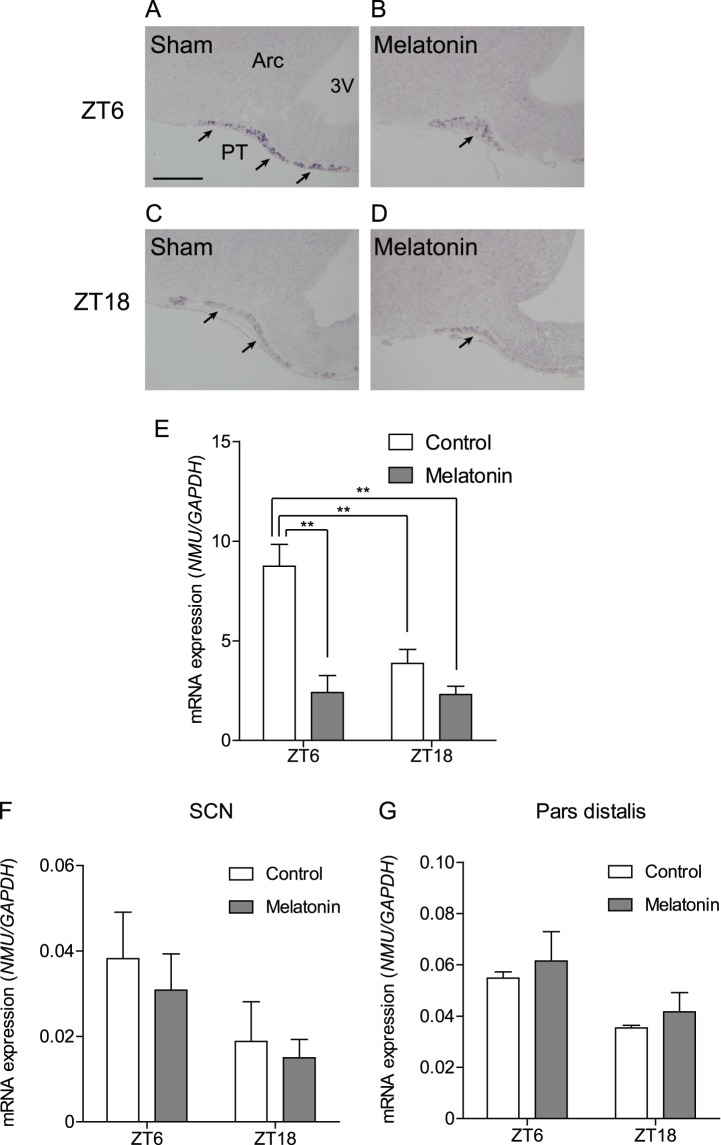
Figure 4. Effects of melatonin on NMU mRNA expression in the PT, PD, and SCN.
(A–D) Microphotograph of NMU mRNA expression detected by ISH in the PT of control and melatonin-treated groups at ZT6 and ZT18. (A, B) Staining signal in the PT was decreased in the melatonin-treated group compared to the sham group at ZT6. (C, D) In the ZT18 samples, a similar staining intensity was observed in the sham and melatonin-treated groups. Scale bar: 200 µm. PT, pars tuberalis; ARC, arcuate nucleus; 3V, third ventricle. (E) qPCR analysis of NMU in the PT was performed for the sham and melatonin groups at ZT6 and ZT18 using LMD samples. Two-way ANOVA revealed a significant interaction between melatonin treatment and time point (P<0.05) and that the NMU mRNA expression level of the ZT6 melatonin group was significantly higher than that of the ZT6 melatonin, ZT18 control, and ZT18 melatonin groups (one way ANOVA, P<0.01). (F, G) qPCR analysis for NMU in the SCN and PD performed for the sham and melatonin-treated rats at ZT6 and ZT18. NMU mRNA expression in the SCN and PD were considerably lower and not influenced by time or melatonin treatment.

