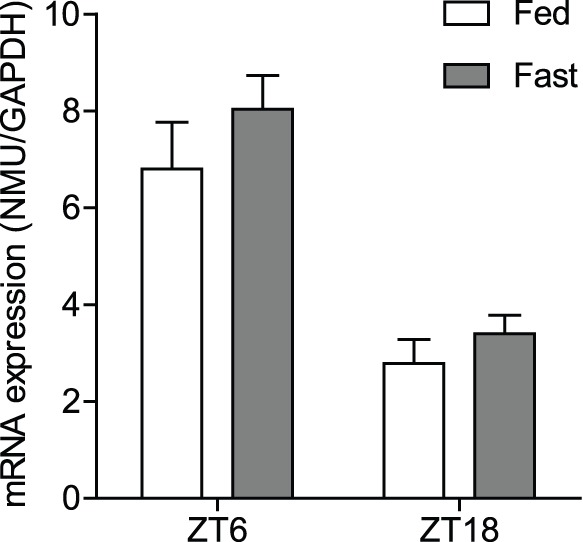
Figure 5. Effects of fasting on NMU mRNA expression in PT.

qPCR analysis of NMU in the PT performed for the sham and fasting groups at ZT6 and ZT18. The NMU mRNA expression level was not changed when the sham group was compared with the fasting group at both sampling times, ZT6 (fasting from ZT6 to ZT6 for 48 h) and ZT18 (fasting from ZT18 to ZT18 for 48 h), and the diurnal change was maintained even under fasting conditions (high at ZT6, low at ZT18, P<0.01; ZT6 control vs. ZT18 control, ZT6 fasting vs. ZT18 fasting).
