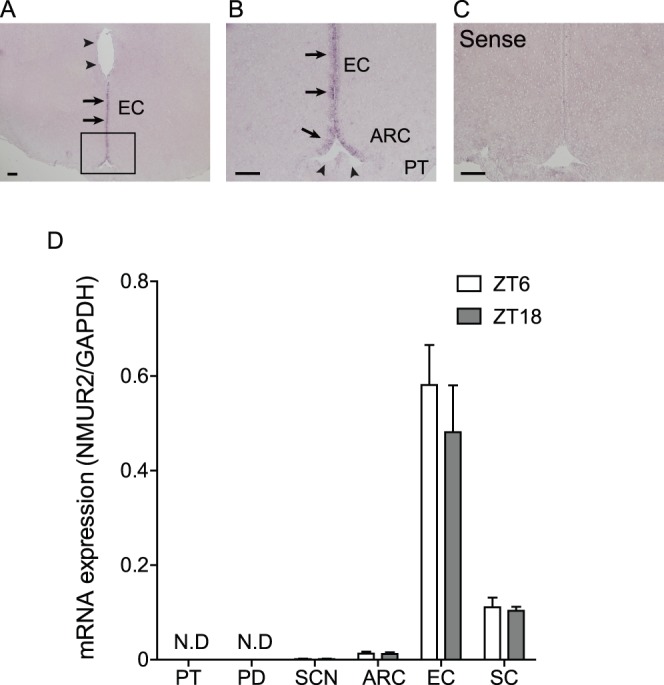
Figure 6. NMU receptor type 2 mRNA expression in the rat brain.

(A) Microphotograph of NMU mRNA expression detected by ISH in the fixed frozen sections of the rat brain. Staining signal was detected in the EC of the 3V (arrows). Upper part of the EC of 3V did not show NMUR2 expression (arrowheads). (B) Enlarged view of A. The staining signal was found in the EC of the 3V (arrows), but not in the bottom of the 3V, adjacent to the median eminence (arrowheads). (C) Sense RNA probes to NMUR2 generated no specific signal. Scale bar: 200 µm. PT, pars tuberalis; ARC, arcuate nucleus; 3V, third ventricle; EC, ependymal cell layer of the third cerebroventricle. (D) qPCR analysis of NMUR2 in the PT, PD, SCN, ARC, EC, and SC at ZT6 and ZT18. NMUR2 expression was detected in the EC at the highest level, followed by the ARC and SC, and was detected in the SCN at a considerably lower level. NMUR2 expression was not detected in the PT and PD. NMUR2 expression did not change at either time point in the SCN, ARC, EC, and SC.
