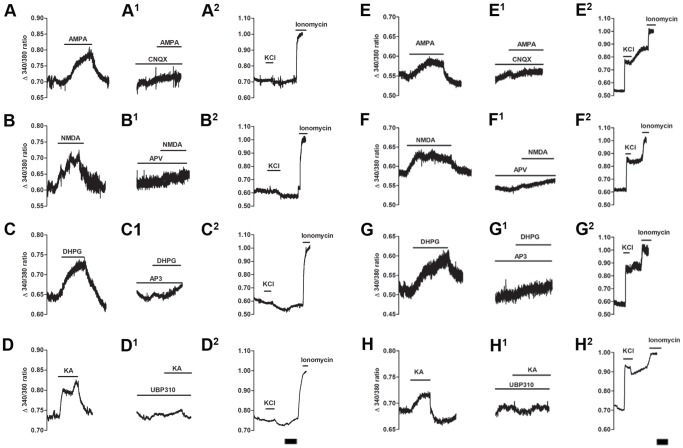
Figure 4. Representative calcium imaging traces of SGCs and neurons following application of glutamate agonists and antagonists.
Following direct application of A: AMPA (50 µM), B: NMDA (100 µM), C: DHPG (100 µM) and D: KA (30 µM) both neurons and SGCs responded to all three agonists. Following a HEPES buffer wash the same cells were then given the appropriate selective antagonist: A1, E1: CNQX (100 µM); B1, F1: APV (100 µM); C1, G1: AP3 (1 mM) and D1, H1: UBP310 (0.5 µM) for 5 minutes prior to second application of agonist. In the presence of its antagonist, the effect of each agonist was blocked (A1–D1 SGCs; E1–H1 neurons). A2–H2, ten minutes after HEPES buffer wash, KCl (50 mM) was given to identify neurons in the recorded field and ionomycin (20 µM) was added to test cell viability at the end of the experiment. Lines show the duration of application. Scale bar = 5 minutes.

