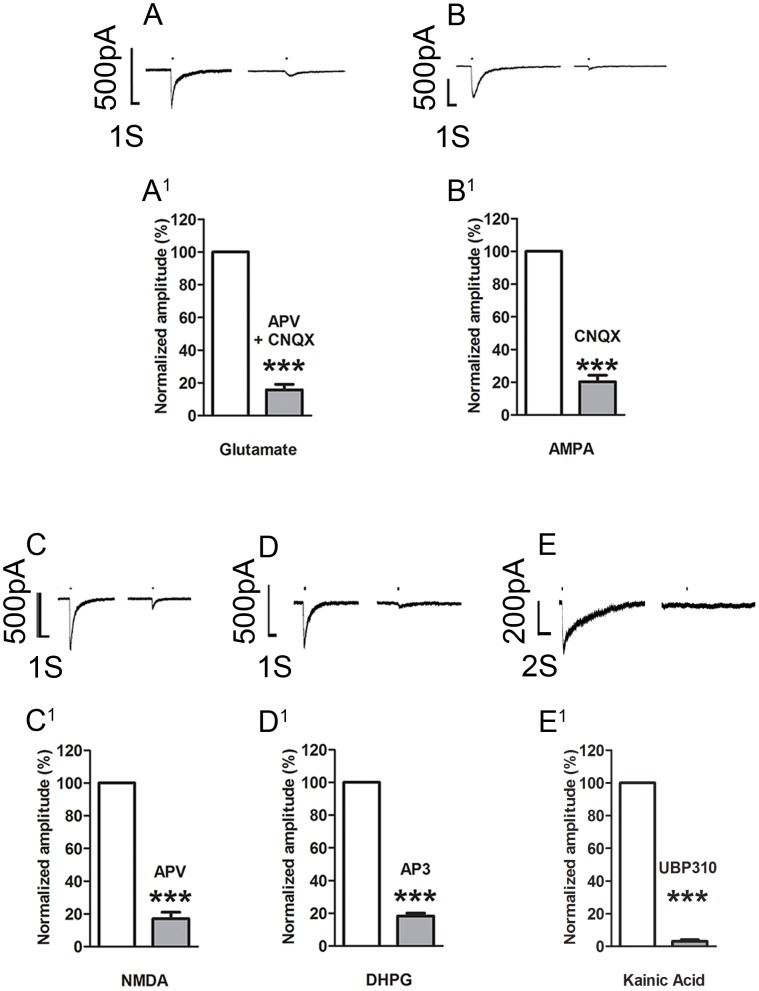
Figure 6. Whole cell patch recordings of small neurons from ex-vivo dorsal root ganglia.
A–E, puff application of glutamate or the receptor selective agonists induced inward currents which were blocked (right trace) by bath application of the appropriate selective antagonist(s). A1–E1, bar graphs showing the reduction in standardized amplitude of the receptor induced currents in presence of the appropriate antagonist. See Table 1 for drug concentrations. The bars above all the traces indicate agonist application time (200 ms). The decay time for AMPA induced current is: 520.0±70.4 ms; NMDA: 461.9±39.7 ms; Glutamate: 537.0±50.8 ms; KA: 512.4±482.4 ms; DHPG: 90.1±25.8 ms. All data are expressed as mean ± SEM. ***P<0.001.

