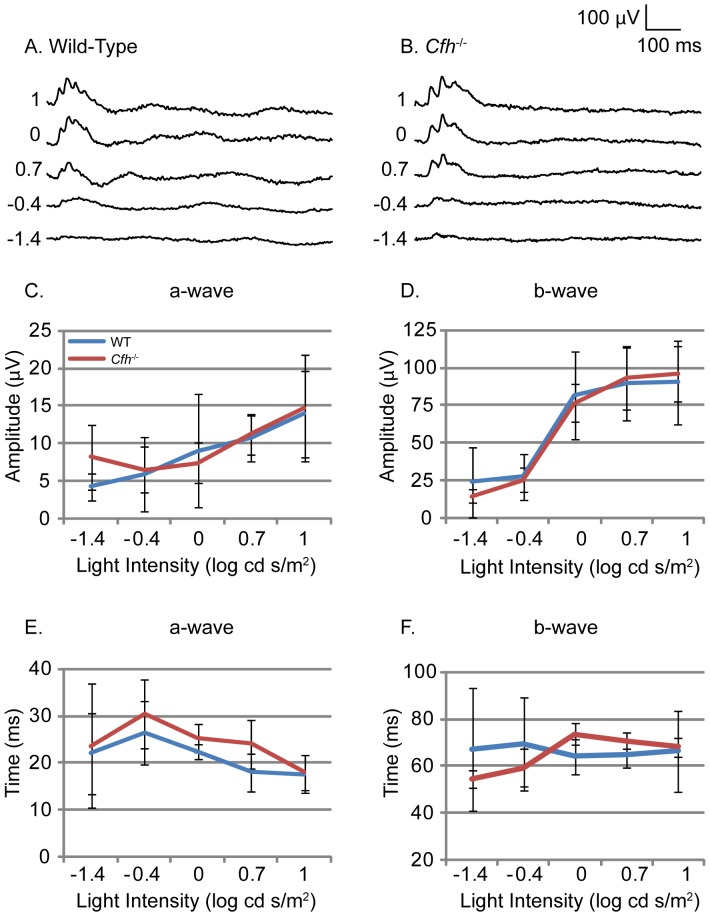
Figure 3. Electroretinogram response to light under photopic conditions in wild-type and Cfh −/− mice.
Electrophysiological assessment of retinal function by electroretinogram (ERG) was performed on one year old Cfh−/− and wild-type mice. Light-adapted mice were used to assess photopic neural retinal responses. Representative ERG traces (A and B) in response to flash stimuli of increasing log intensity. Mean amplitude of a-wave (C) and b-wave (D) measured from wild-type (blue line) and Cfh −/− (red line) mice. Time to peak of the a-wave (E) and b-wave (F) measured from wild-type and Cfh −/− mice. WT n = 6, KO n = 5.

