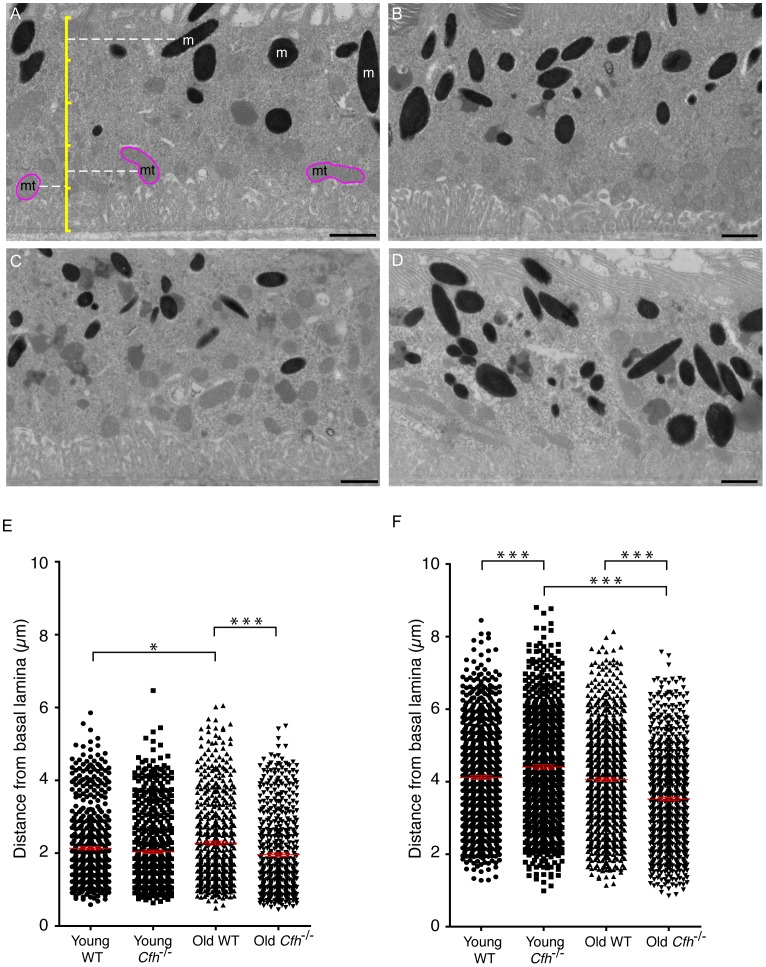
Figure 4. Organelle positioning in the retinal pigment epithelium.
Transmission electron micrographs of 70–80 nm sections of RPE from (A & B) 7–8 week old and (C & D) 1 year old (A & C) wild-type and (B & D) Cfh −/− mice. Scale bars represent 1 µm. In (A) an illustrative scale bar (yellow) shows how the positions of melanosomes (m) and mitochondria (mt) were mapped, so that the distances of (E) mitochondria and (F) melanosomes were measured from the basal lamina. Each scatter plot shows quantification of >500 mitochondria or >750 melanosomes per group where each dot represents one organelle. *P<0.05; ***P<0.001. n = 5.

