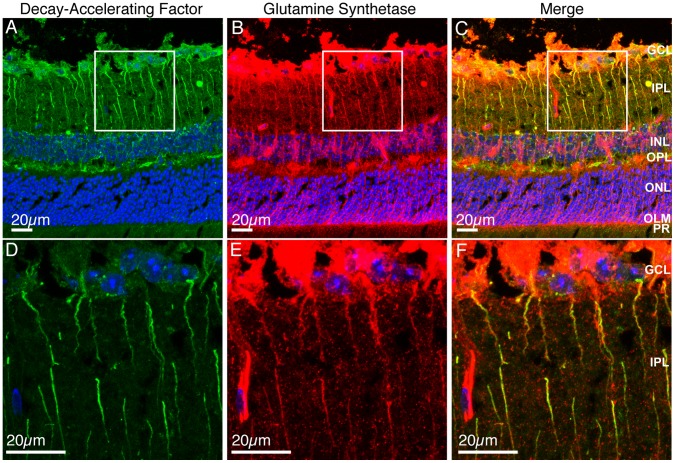
Figure 7. Decay-accelerating factor expression co-localises with glutamine synthetase in Müller cells.
12 µm PFA-fixed sections from old Cfh −/− retinas were stained for DAF (green), glutamine synthetase (red) and nuclei (blue). Maximum intensity projections were made of a 9 µm z-stack of DAF and nuclei (A and D), glutamine synthetase and nuclei (B and E) or merge (C and F). White boxes of low power images (A-C) indicate regions where high power images were taken (D-F). GCL, ganglion cell layer; IPL, inner plexiform layer; INL, inner nuclear layer; OPL, outer plexiform layer; ONL, outer nuclear layer; OLM, outer limiting membrane; PR, photoreceptors. Images are representative of three independent experiments. Scale bars = 20 µm.

