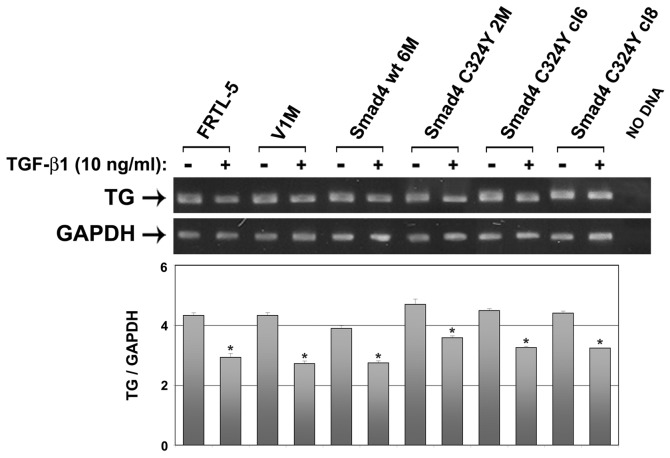
Figure 3.
TG expression in Smad4 C324Y stable clones. Semiquantitative reverse transcription-polymerase chain reaction (RT-PCR) was performed on cDNAs obtained from FRTL-5, V1M, Smad4 wt 6M and Smad4 C324Y clones, treated or not with 10 ng/ml TGF-β1 for 24 h. Data reported represent the mean of three independent experiments. Histogram of densitometric analysis of TG bands normalized to the GAPDH levels [* indicates a statistical significance (Student’s t-test, P<0.05) of treated vs. untreated cells].

