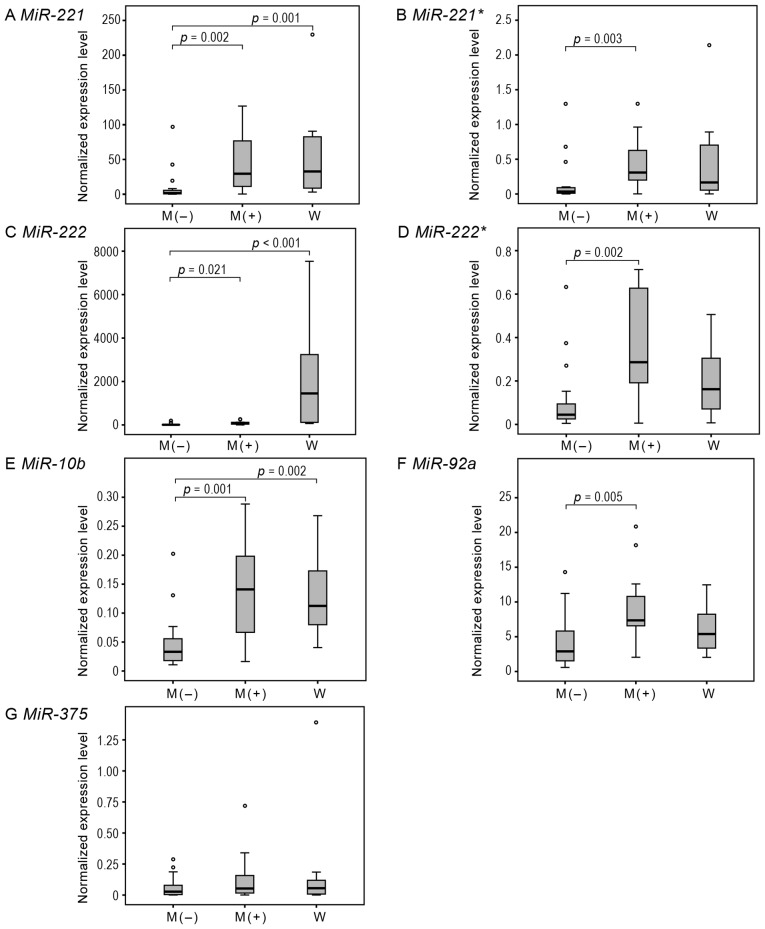
Figure 1.
Quantitative PCR analysis to assess the expression levels of miR-221, miR-221*, miR-222, miR-222*, miR-10b, miR-92a and miR-375 in MI-FTC and WI-FTC. Box plots show the expression levels of these miRNAs in M(+) MI-FTC and WI-FTC (W) samples compared to those in M(−) MI-FTC samples. The expression levels of these miRNAs were absolutely quantified and normalized for the expression level of RNU44 in each sample; miRNA (amol/μl)/RNU44 (amol/μl). Six miRNAs [(A) miR-221, (B) miR-221*, (C) miR-222, (D) miR-222*, (E) miR-10b, (F) miR-92a and (G) miR-375] are shown to be significantly upregulated in M(+) samples compared to M(−). Three miRNAs [(A) miR-221, (C) miR-222 and (E) miR-10b] are shown to be significantly upregulated in W samples compared to M(−). Lines inside boxes denote medians, the boxes represent the interquartile range and whiskers extend to the most extreme values within 1.5 times the interquartile range. Outliers are indicated with circles. The statistical differences among these three groups are analyzed by Kruskal-Wallis test.

