
Figure 2. SDS-PAGE and Western blotting analysis of Avenin-like b proteins in transgenic and control lines.
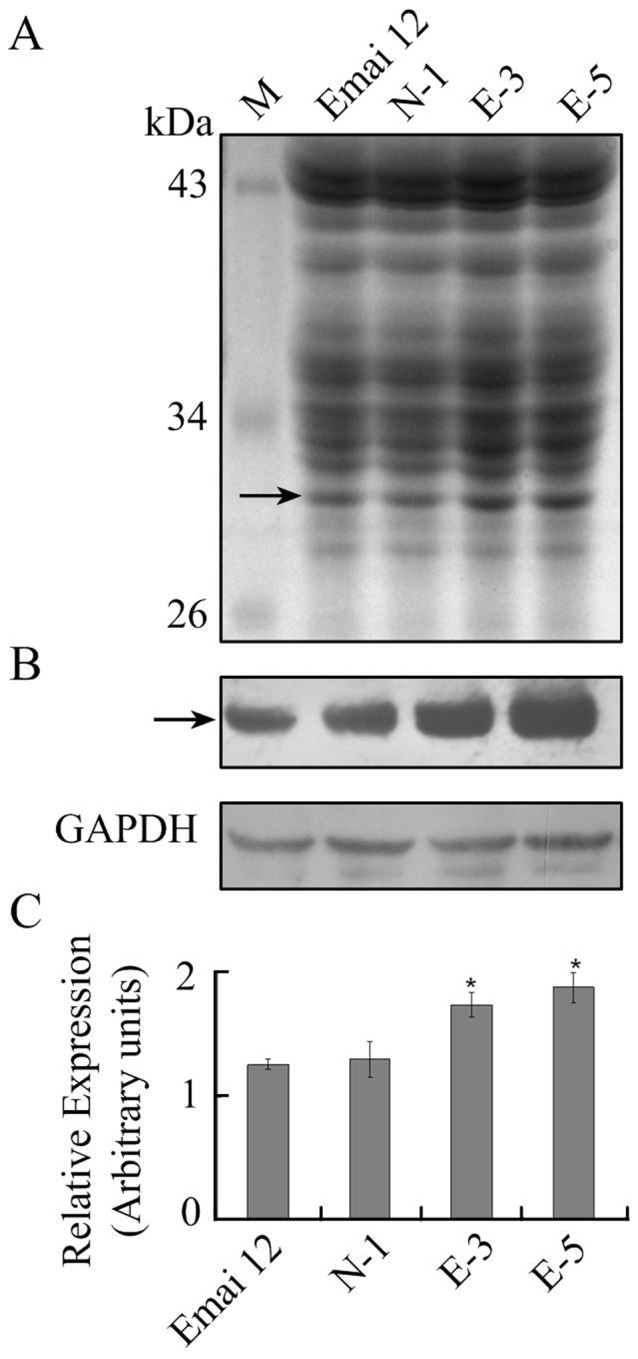
Total gluten protein extracted from flours were visualized on stained SDS-PAGE gels (A) and then specifically detected by Western blotting (B). Relative amounts of Avenin-like b proteins (C) were densitometry quantified with respect to the non-transformed control cv. Emai 12. Lines E-3 and E-5 were transgenic lines overexpressing avenin-like b gene, while lines N-1 and Emai 12 were non-transgenic line and non-transformed control line, respectively. Arrow indicates the position of the transgenic Avenin-like b proteins. Housekeeping protein GAPDH was used as control to normalize for equal amounts of proteins and to calculate the relative loading volume for each sample.