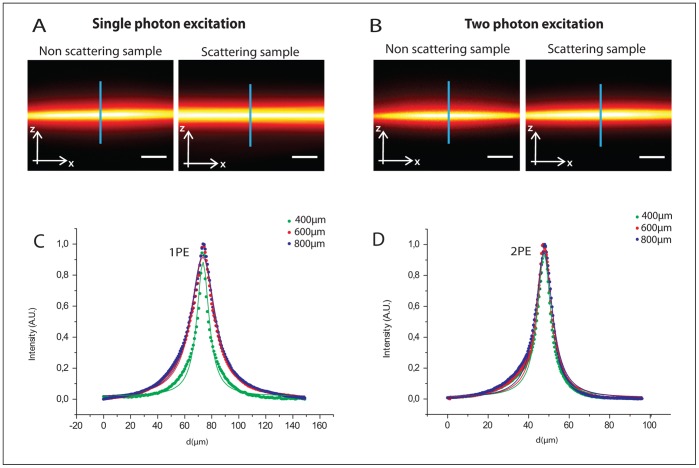
Figure 2. Single-photon (2A) and two-photon excitation (2B) cross-sectional views of light-sheet intensity distribution in scattering phantom samples (µs = 50mm −1) and quite transparent (µs = 5mm−1) phantom samples.
The excitation intensity distribution can be characterized measuring the thickness of the axial profile along the detection axis z (blue line). Imaging of the effective light-sheet fluorescence intensity distribution in scattering phantom samples (µs = 50 mm−1) and quite transparent (µs = 5 mm−1) phantom samples is performed at different illumination depths: 400 µm, 600 µm, and 800 µm. Intensity profiles of the XZ cross-section (blue line in fig. 2A, 2B) within the scattering phantom sample under 1PE (2C) and 2PE regime (2D). A greater enlargement of the thickness of the effective excitation distribution is evident for 1PE compared to 2PE. Scale Bar = 20 µm. Objective: Leica HCX APO L U–V–I 40×. Excitation wavelengths used: 488 nm and 790 nm respectively.

