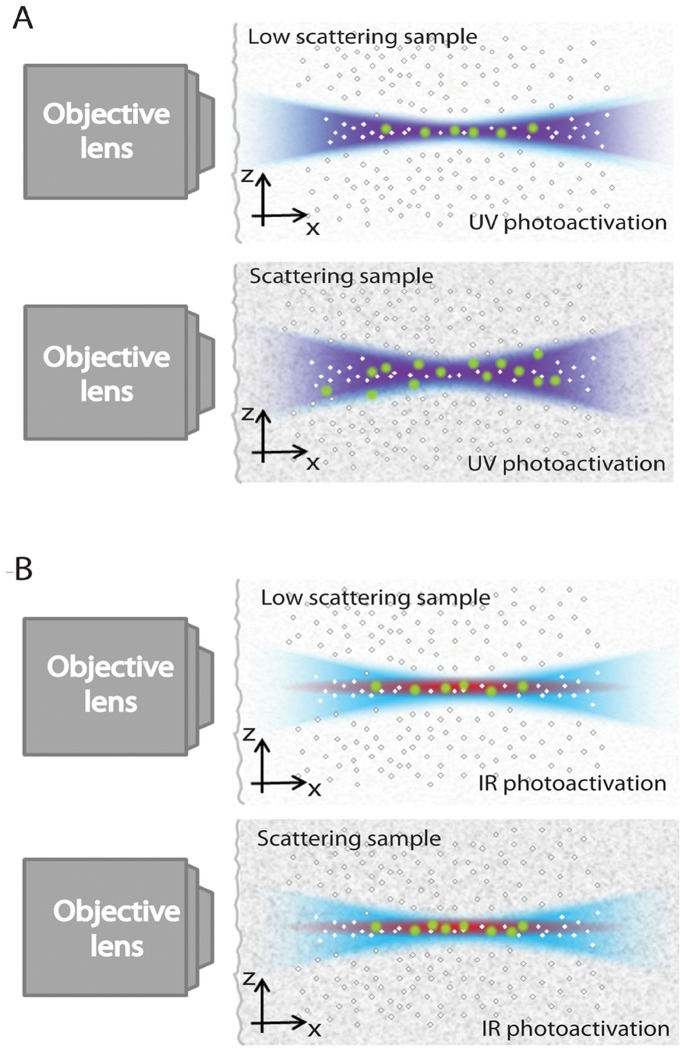
Figure 4. Schematic diagram of the photoactivation and excitation volumes in IML-SPIM: photoactivation performed using UV light (violet) exhibits a lower spatial confinement (4A) in the presence of scattering samples compared to two-photon (red) induced photoactivation (4B).
Readout, performed in the VIS range (light blue), is used to a sparse subset of activated molecules (green) in a confined region.

