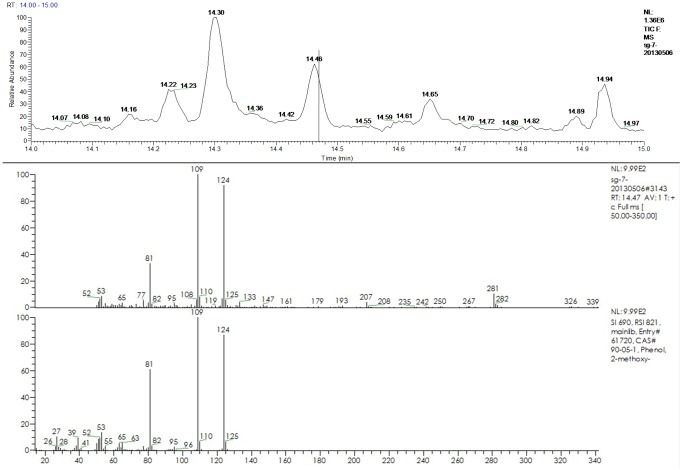
Figure 5. A GC–MS chromatogram of pH adjusted kiwi fruit juice inoculated with C-ZJB-12-35.
Mass spectrums from the peak (14.47 min) thought to be guaiacol in this sample and from standard guaiacol are also shown. The compound peaked at 281 m/z may come from the SPME fiber, because it exist in the peak around 14.47min in all samples. Because the scanning mass range was 50–350 m/z, peaks below 50 m/z were not included. Both of these may reduce the SI and RSI values.

