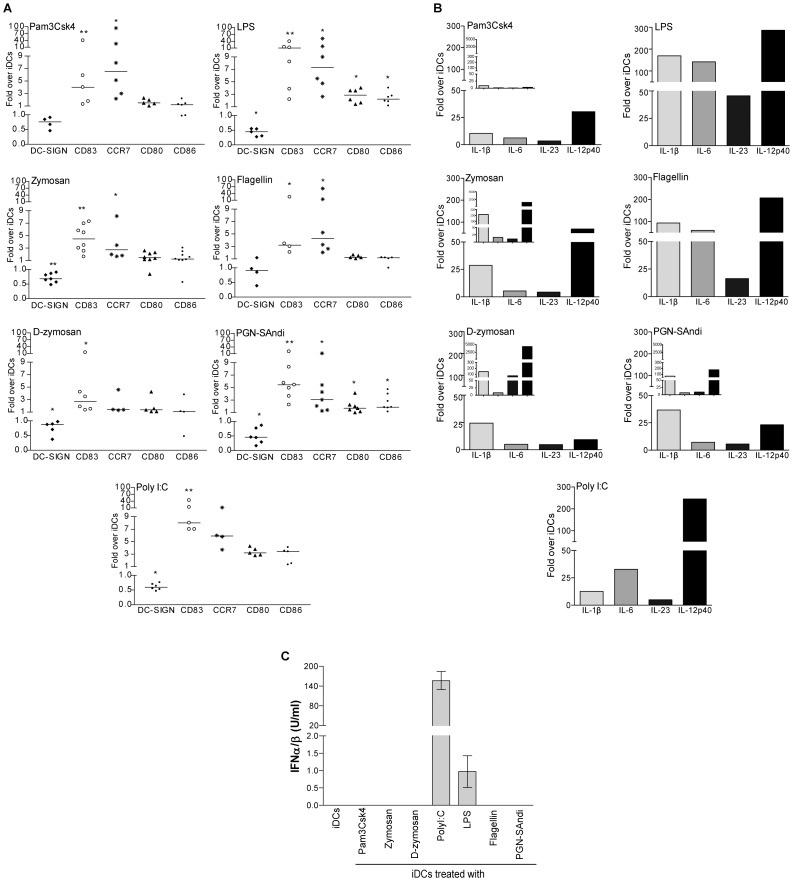
Figure 2. The nature of PAMPs modulates both maturation profile and cytokine expression pattern of DCs.
(A) iDCs were either left untreated or treated for 72 hours with the indicated PAMPs. Afterwards, cell surface expression of DC-SIGN, CD83, CCR7, CD80 and CD86 was evaluated by flow cytometry. Data are expressed as the percentage of positive cells multiplied by the mean fluorescence intensity for the PAMP-stimulated DCs compared to untreated DCs (i.e iDCs). Each point represents a different donor. The horizontal line represents the median of the values for all donors. Asterisks denote statistically significant data (*: p<0.05; **: p<0.01). (B) iDCs were treated with the indicated PAMPs for 4 or 24 hours (small inserts) and total RNA was extracted. The variation of IL-1β, IL-6, IL-23 and IL-12p40 mRNA levels was evaluated by real-time PCR. After normalization on 18S ribosomal RNA subunit, the variation of mRNA levels for each cytokine was compared to that of untreated cells. Data depicted represent results obtained from one representative donor out of four. (C) iDCs were either left untreated or stimulated for 6 hours with the listed microbial-derived products. Cell-free supernatants were harvested and the levels of IFNα/β were quantified using HEK-Blue™ IFNα/β cells. Data shown represent the mean ± standard deviations of quadruplicate samples from one donor representative of two.

