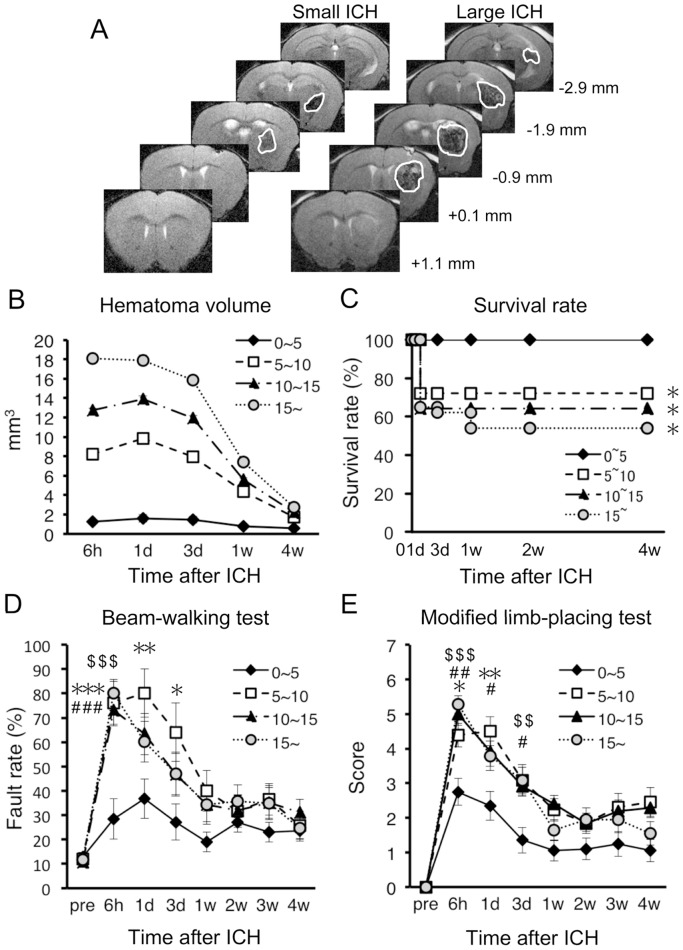
Figure 1. Relationship of hematoma volume with mortality and neurological dysfunctions in mouse ICH model.
(A) Representative images of T2-MRI scans (+1.1 mm to −2.9 mm relative to bregma) in a mouse with small hematoma and a mouse with large hematoma at 6 h after induction of ICH. Boundary between hematoma and surrounding tissues is indicated by solid white line. (B) Time-dependent changes of hematoma volume in four groups of mice categorized by the initial volume of hematoma at 6 h after induction of ICH; <5 mm3 (n = 20 at 6 h), 5–10 mm3 (n = 18 at 6 h), 10–15 mm3 (n = 38 at 6 h) and >15 mm3 (n = 37 at 6 h). (C) Survival rate of mice after ICH. (D) Performance of mice in the beam-walking test evaluated by hindlimb fault rate. (E) Performance scores in the modified limb-placing test. Data sets consist of values derived from all mice surviving at each time point. *P<0.05, **P<0.01, ***P<0.001, 5–10 mm3 group versus <5 mm3 group; # P<0.05, ## P<0.01, ### P<0.001, 10–15 mm3 group versus <5 mm3 group; $$ P<0.01, $$$ P<0.001, 10–15 mm3 group versus <5 mm3 group.

