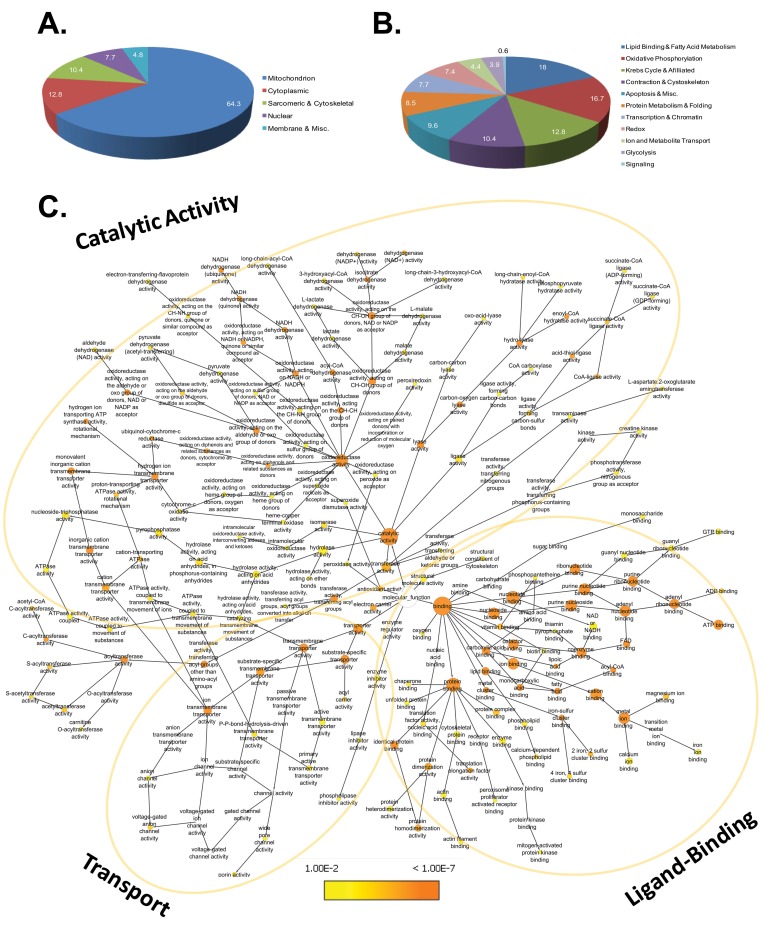
Figure 4. Functional Annotation and Enrichment analysis.
Panel A. Distribution of acetylation sites by cellular component. Panel B. Distribution of acetylation sites by biological process. Data for panels A and B were taken from Figure 3 and expressed as percentages of the total number of sites. Panel C. Network of gene ontology annotations for molecular function. Node color represents the magnitude of corrected p-value, a continuous variable that provides a measure of enrichment (see legend). Node size is proportional to the number of genes associated with each GO-term. The layout is broadly grouped by similar molecular functions, including catalytic activity, ligand binding and transport activity.

