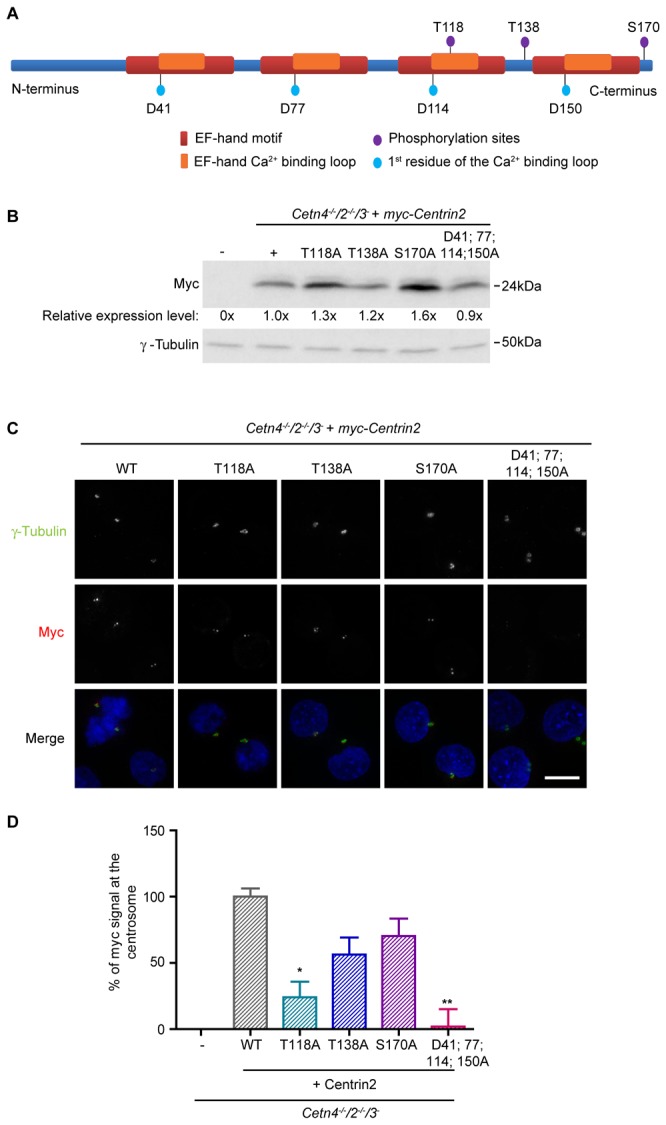
Figure 1. Localisation of centrin2 to the centrosome.

A. Bar diagram of chicken centrin2, showing the relative positions of the phospho-sites and EF-hand residues that were mutated in this study.
B. Immunoblot showing the relative expression levels of the myc-centrin2 transgenes in the clones used in this study. Numerical values show the mean of 3 separate experiments.
C. Immunofluorescence micrograph showing the localisation of wild-type and the indicated mutants of centrin2 after stable transfection of Cetn4 -/- /2 -/- /3 - DT40 cells. DNA was labelled with DAPI (blue). Scale bar, 5 µm.
D. Quantitation of the relative centrin2 signal detected at the centrosome (co-localisation with γ-tubulin). Histogram shows the mean percentage + s.d. of the control signal seen in at least 1000 cells in 3 separate experiments. The control was Cetn4 -/- /2 -/- /3 - DT40 cells that stably expressed wild-type myc-centrin2. *, P <0.05; **, P <0.01 compared to controls by Kruskal-Wallis test and Dunn’s multiple comparison test. Size markers are indicated at right.
