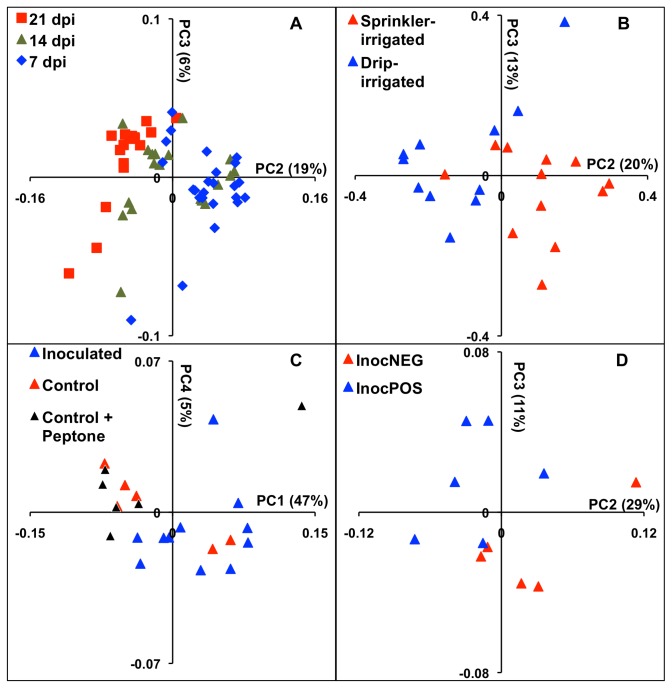
Figure 7. Phyllosphere microbiota differs due to effects of the day of collection, irrigation, and inoculation of E. coli O157:H7.
Phyllosphere microbiota identified during the L10 were analyzed by Principal Coordinates Analysis (PCoA) performed on Unifrac distances between bacterial communities collected from plants on different days (A), and for plants at 14 dpi exposed to drip or overhead irrigation (B), the inoculation of E. coli O157:H7 (C), or inoculated plants that were InocPOS or InocNEG (D). Weighted UniFrac distances were used for (A), (C), and (D) and unweighted UniFrac distances were used for (B). The plots are representative of findings for the other field trials and time points. Additional PCoA plots are in Figure S7.

