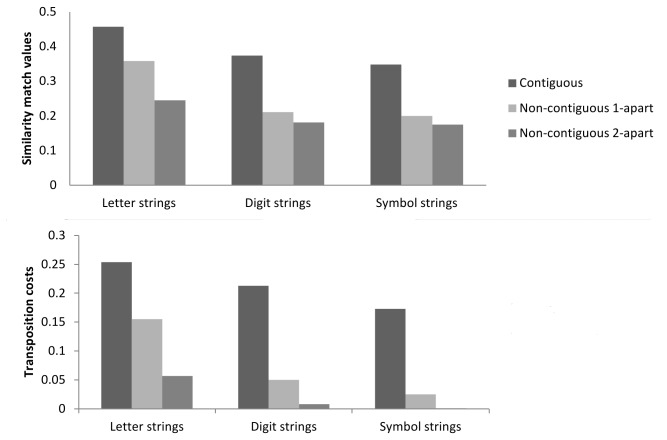
Figure 3. Fits of the overlap model.
Top panel: similarity match values from the overlap model for the letter, digit and symbol strings for the different experimental conditions (note that different values of the s-parameter were used to simulate different effects for different types of character). Bottom panel: transposition cost values from the overlap model for the three types of string obtained by subtracting match values for letter transpositions from match values for letter replacements for each type of letter transposition.

