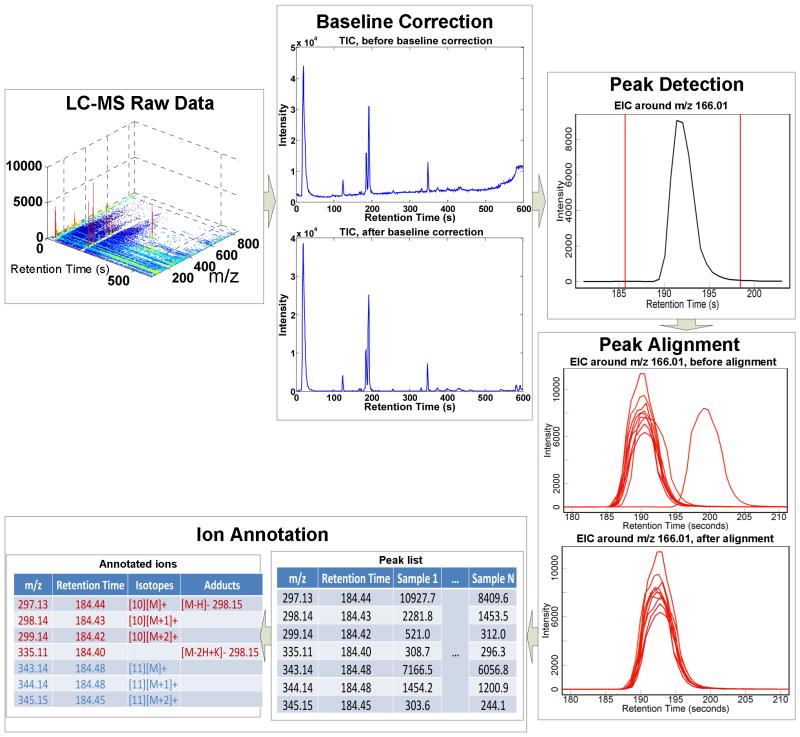
Fig. 3.
Preprocessing of a LC-MS dataset with 10 samples. The LC-MS raw data are first corrected for baseline effect, and then peak detection is performed on each EIC to detect the peak(s). For multiple samples peak alignment is used to correct for retention time drift. The peak list can be acquired after peak alignment for the dataset. Ion annotation is used to recognize the peaks originating from the same metabolite. The data are acquired using a UPLC-QTOF Premier instrument.

