
Figure 4.
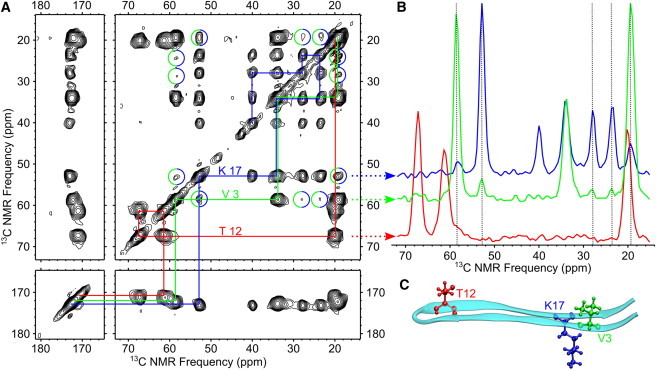
(A) 2D 13C-13C DARR NMR spectrum of Sample A showing long-range (up to ∼0.6 nm) contacts between labeled sites. Solid lines indicate single-bond assignment pathways for each 13C-labeled residue. Contacts between V3 and K17 are indicated with circles. (B) Horizontal slices at peak frequencies of V3 Cα, T12 Cβ, and K17 Cα signals. Vertical dotted lines indicate polarization transfers between the V3 and K17 signals. (C) A molecular model indicating relative positions of labeled residues within a β-hairpin.