
Figure 5.
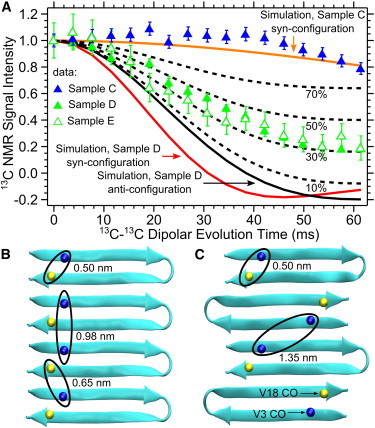
(A) PITHIRDS-CT NMR data for Samples C, D, and E. The solid curves show simulated behaviors for 8 13C nuclei at V3 CO and V18 CO positions within MAX8 β-sheets arranged as shown in panels B and C. Dashed curves show how the Sample D anti configuration curve is expected to change upon incorporation of the indicated percentages of MAX8 molecules in minor conformations that do not exhibit 13C-13C dipolar couplings. (B) A representation of a β-sheet with MAX8 β-hairpins arranged in the syn configuration. (C) An alternative β-sheet with MAX8 β-hairpins arranged in the anti configuration. V3 CO and V18 CO atoms are shown as spheres.