
Figure 4.
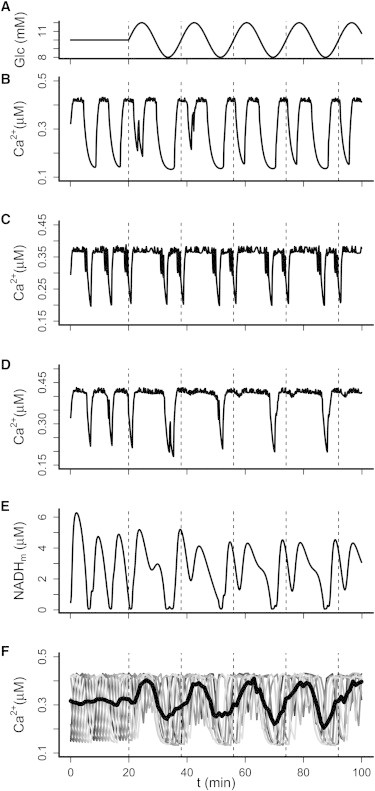
Model simulations of 1:2 entrainment. (A–D) In response to slowly oscillating glucose concentrations (A; mean 10 mM, amplitude 2 mM, period 18 min), various 1:2 entrainment patterns are seen (B–D). (E) The Ca2+ pattern in D resembles 1:1 entrainment despite being a result of clear 1:2 entrainment of the underlying metabolic oscillator, illustrated by mitochondrial NADH. Parameters take default values except that in C, KGK = 8.0 mM and K(ATP) = 14,300 pS, and in D and E, KGK = 8.0 mM. (F) Slow glucose oscillations synchronize eight heterogeneous and out-of-phase model islets (gray curves). Islet heterogeneity was modeled by different KGK-values (9.3–10.0 mM in steps of 0.1 mM). Synchronization by glucose gives rise to distinct pulses in the average Ca2+ concentration (black, thick curve).