Figure 2.
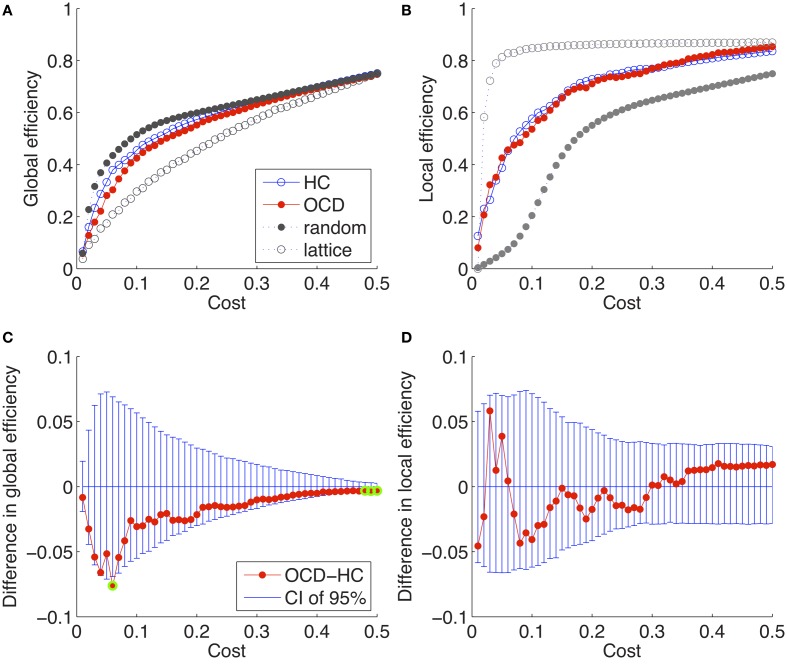
Global efficiencies and local efficiencies of the brain networks of the controls (HC), and the OCD patients (OCD) are plotted over variant rewiring costs with the ones of random and lattice networks with matched costs (A,B). The differences between the OCD patients and controls are plotted with the 95% confidence intervals (CI) of the null distributions obtained from 2000 permutations (C,D). The significantly different points (P < 0.05) are marked with green circles (C). Note that no significant differences were found in the local efficiencies.

