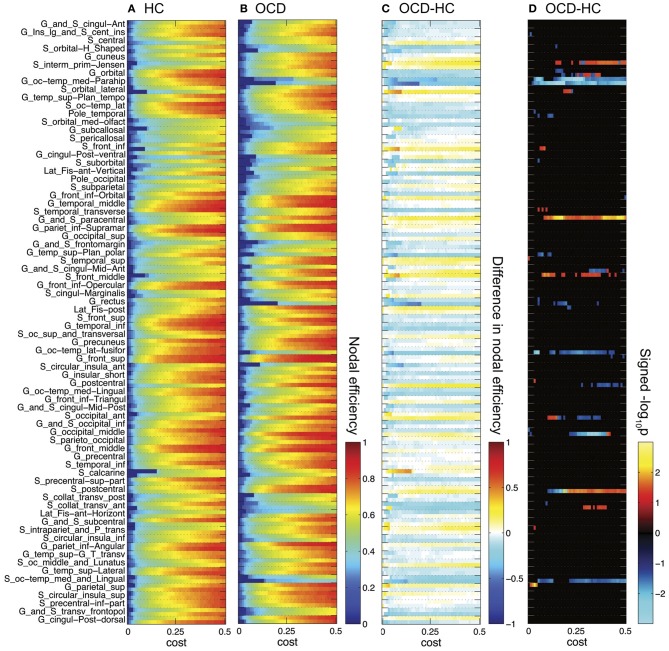
Figure 3.
Nodal efficiencies for 148 ROIs are plotted over cost for the controls (HC, A) and the OCD patients (OCD, B). Along the Y-axis, 74 ROI labels are indicated for each set of two rows separated by dashed horizontal lines (upper row for the left hemisphere; lower row for the right hemisphere). See Destrieux et al. (2010) for abbreviation of the ROI labels. The group differences as HC subtracted from OCD are shown (C). The warm color shows higher nodal efficiency in OCD than in HC, and the cool color shows the opposite. The signed logarithmic p-values for the significance of group differences are also given (D). The positive values means higher nodal efficiency in OCD than in HC (−log10 p > 0), and vice versa (log10p < 0).

