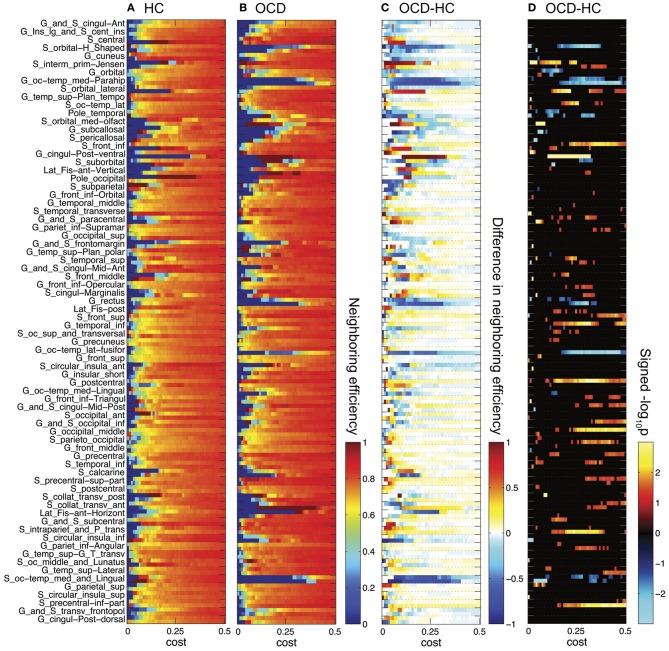
Figure 4.
Neighboring efficiencies for 148 ROIs are plotted over cost for the controls (HC, A) and the OCD patients (OCD, B). The group differences as HC subtracted from OCD (C) and the signed logarithmic p-values (D) are also shown. The same graphical scheme is the same as Figure 3. The warm color means higher neighboring efficiency in OCD than in HC and the cold color means the opposite (C,D).

