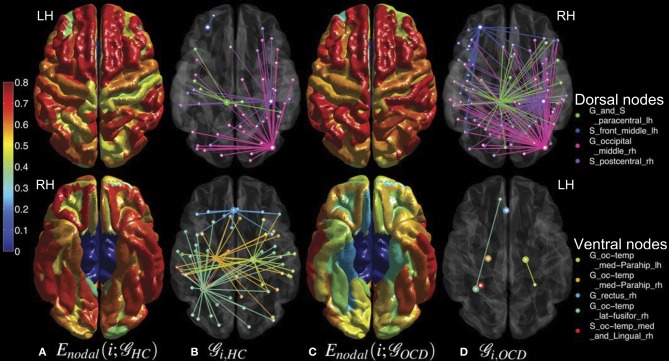
Figure 5.
Mean nodal efficiencies across costs are overlaid on the cortical surfaces of the controls (HC, column A) and the OCD patients (OCD, column C) from a dorsal view (upper row) and a ventral view (lower row). See the color bar on the leftmost side for the color coding from 0 to 0.8. The sub-graphs ( ) of the binary networks at the cost of 0.10 are shown as well for HC (column B) and OCD (column D). From the nodes that showed significantly different nodal efficiencies (marked by thick circles), their first neighbors are connected in distinct colors which correspond to the ROI legend on the rightmost side.

