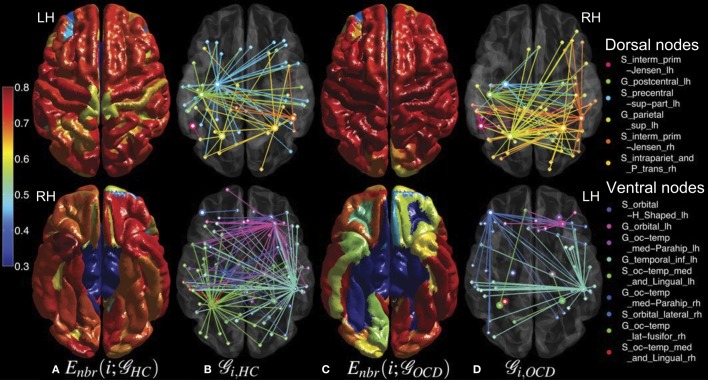
Figure 6.
Mean neighboring efficiencies across costs for the controls (HC, column A) and the patients with OCD (OCD, column C) and the sub-graphs ( ) of the corresponding binary networks at the cost of 0.1 (HC, column B; OCD, column D) are shown in the same graphical scheme as Figure 5, except that the color coding range of neighboring efficiencies is adjusted from 0.3 to 0.8 for a better visualization.

