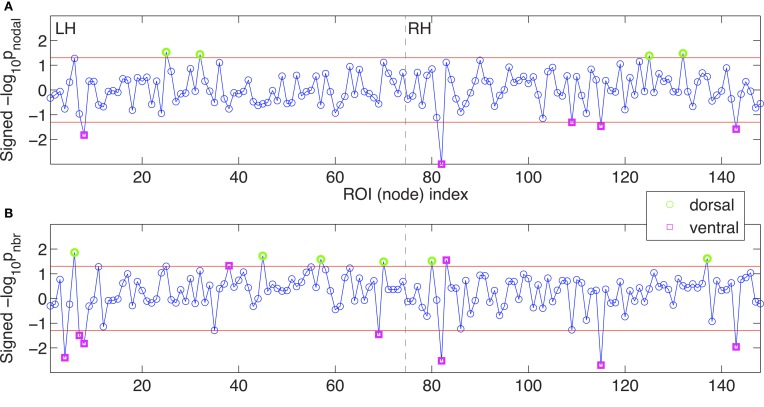
Figure 7.
The mean node-level efficiency measures were compared. Signed logarithmic p-values for nodal efficiency (A) and for neighboring efficiency (B) are given. The x-axis indicates the index of the ROI, or the node, from the left hemisphere (LH) to the right hemisphere (RH), which are separated by dashed vertical lines. Along the y-axis, the positive values mean the higher efficiency measures in OCD patients than in controls (-log10p > 0), and the negative values mean lower efficiency measures in OCD patients (log10p < 0). The significance level of α = 0.05 are marked with red horizontal lines and the suprathreshold nodes are highlighted by green circles (dorsal nodes) or magenta squares (ventral nodes). See Table 2 for ROI labels.

