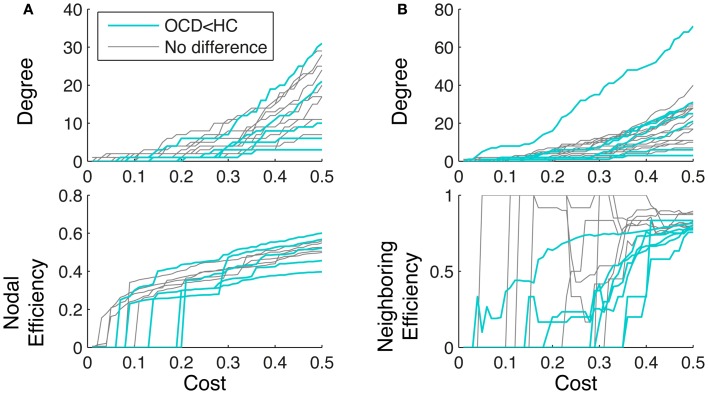
Figure 9.
Degree (upper row) and efficiency (lower row) are plotted over cost for the nodes with smaller nodal efficiency (A, cyan) and smaller neighboring efficiency (B, cyan) from OCD patients. For comparison, the measures of the other nodes from the patients with similar mean degrees are also shown (gray). The nodes with smaller efficiency in OCD than healthy controls exhibits different growth of efficiency even though the mean degrees are similar to the other nodes in OCD.

